Climate & Conflict Analysis
Mapping climate security hotspots
What is the relation between climate change and violent conflicts? Which role do socio-economic scope conditions play in exacerbating climate impact? How can we allow analysts and policymaker to make better decisions — based on heterogenous, multi-faceted information sources?
Premise
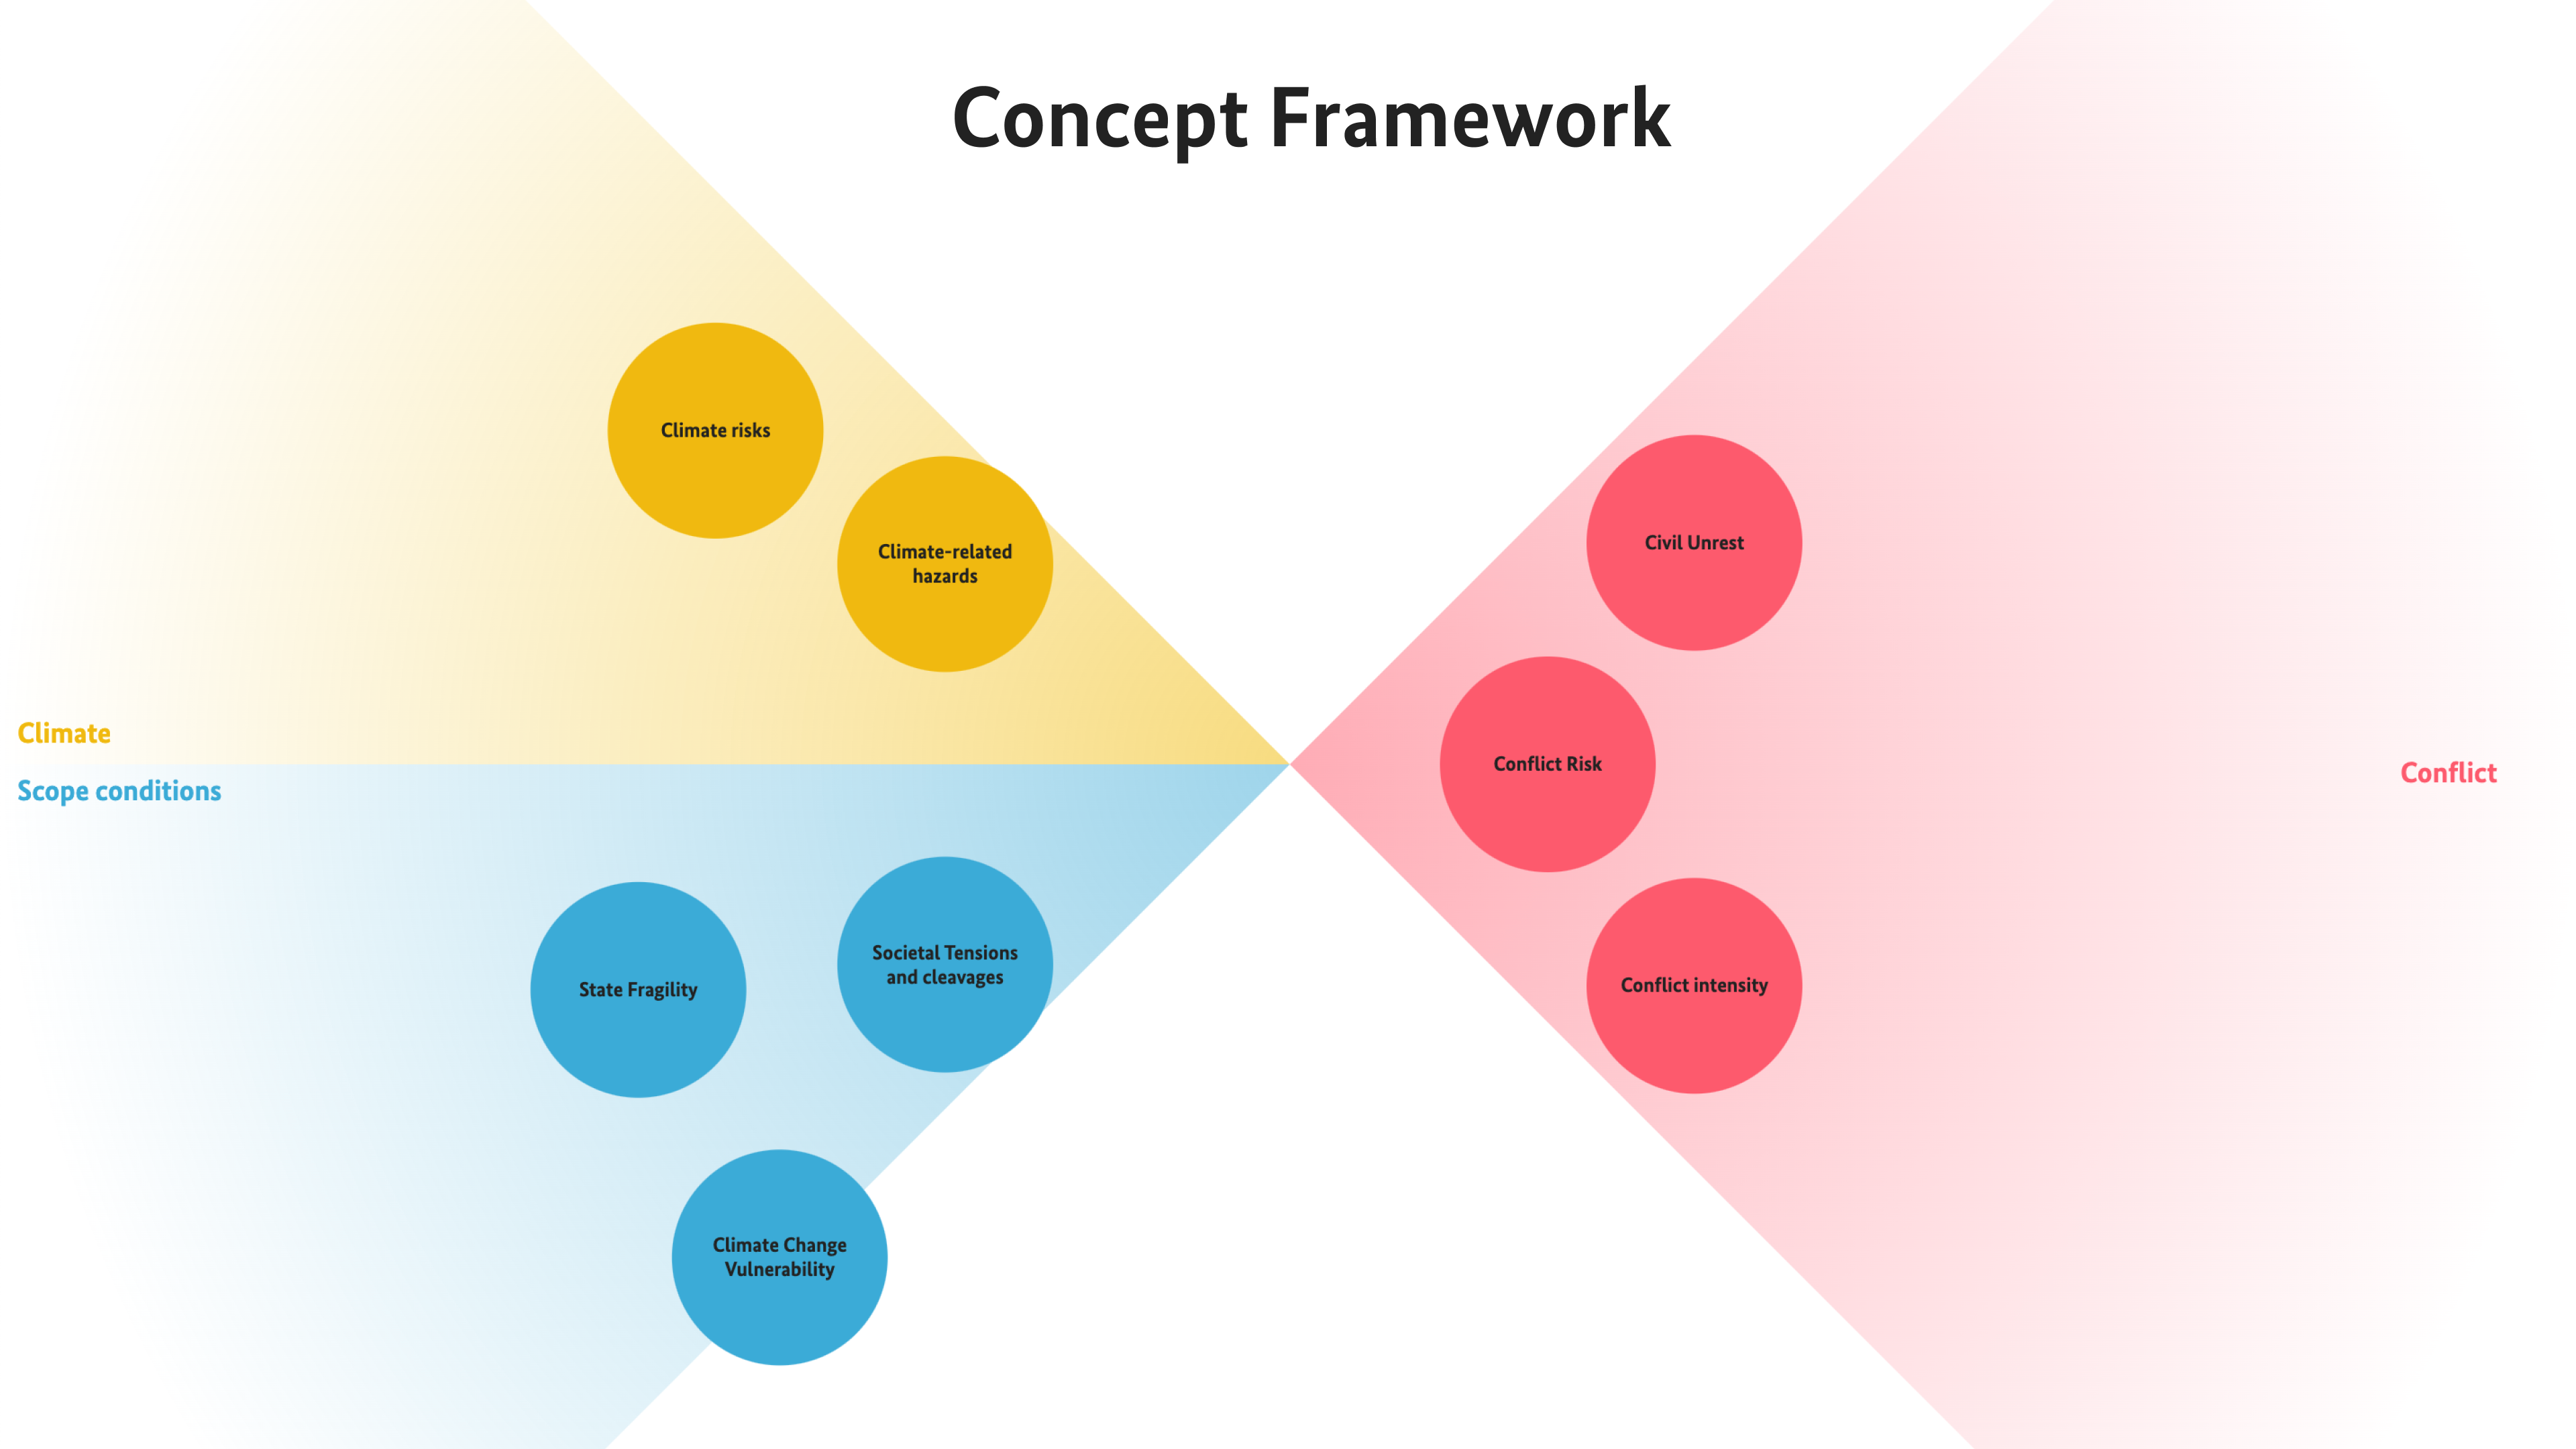
There is significant overlap between countries most affected by climate change and those most at risk of violent conflict. Climate change in the context of conflict is considered a potential “threat multiplier” and the interplay between climate and conflict has received increasing attention from researchers and policymakers over the last two decades.
In collaboration with the PREVIEW team at the German Federal Foreign Office, we set out to explore and visually explain the relationship between climate change and conflict. As part of the project, a consistent, expressive data design language was developed and first demonstrated in a web application introducing the topic to wider audiences.
We are now in the process of guiding the scientific development of a custom climate security index from a design perspective, and advising on the application of the Data Design Language for analysts and policymakers.
Web application
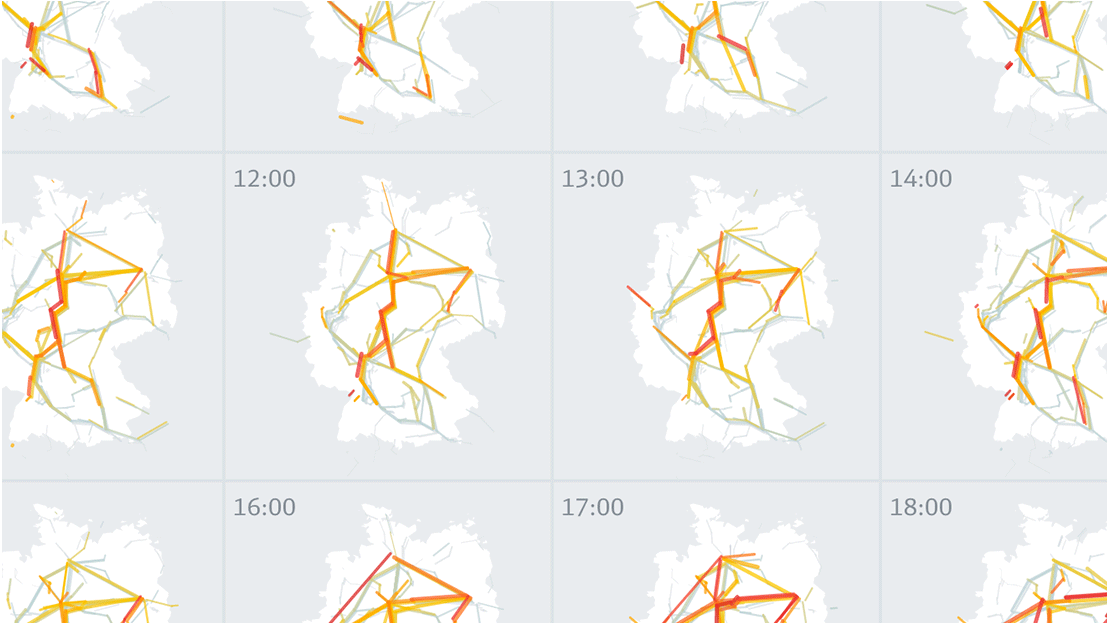
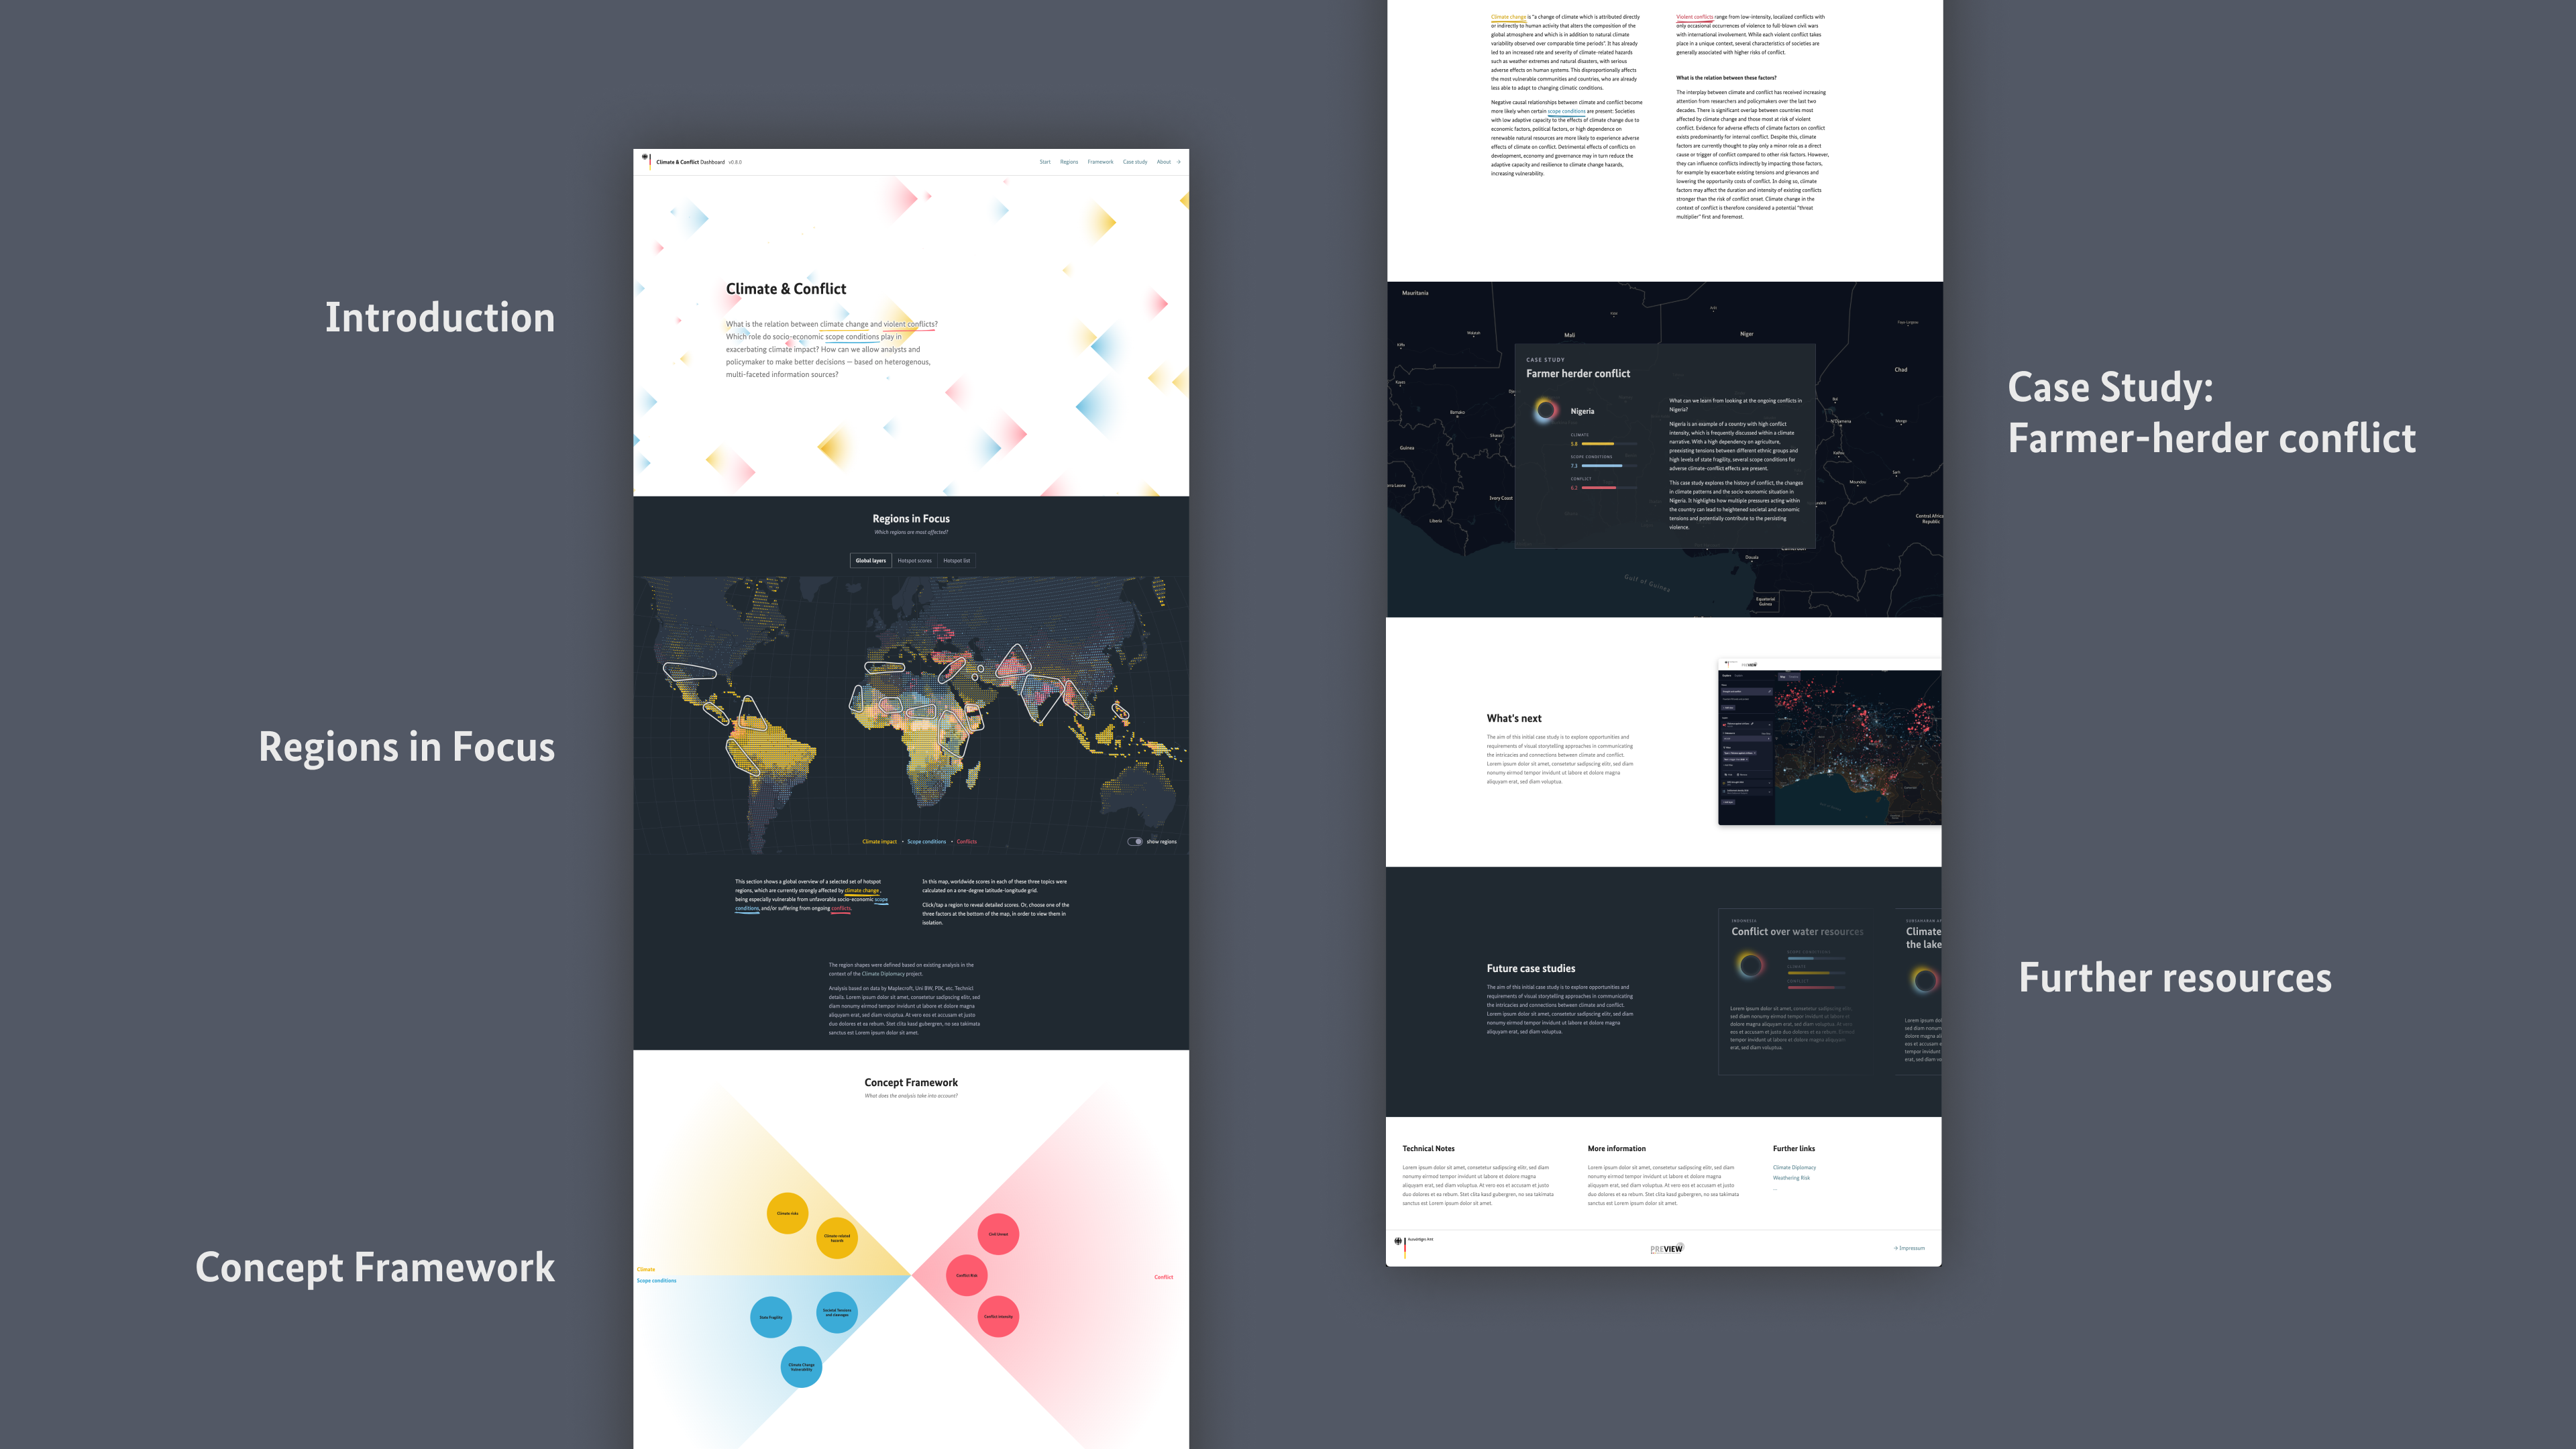
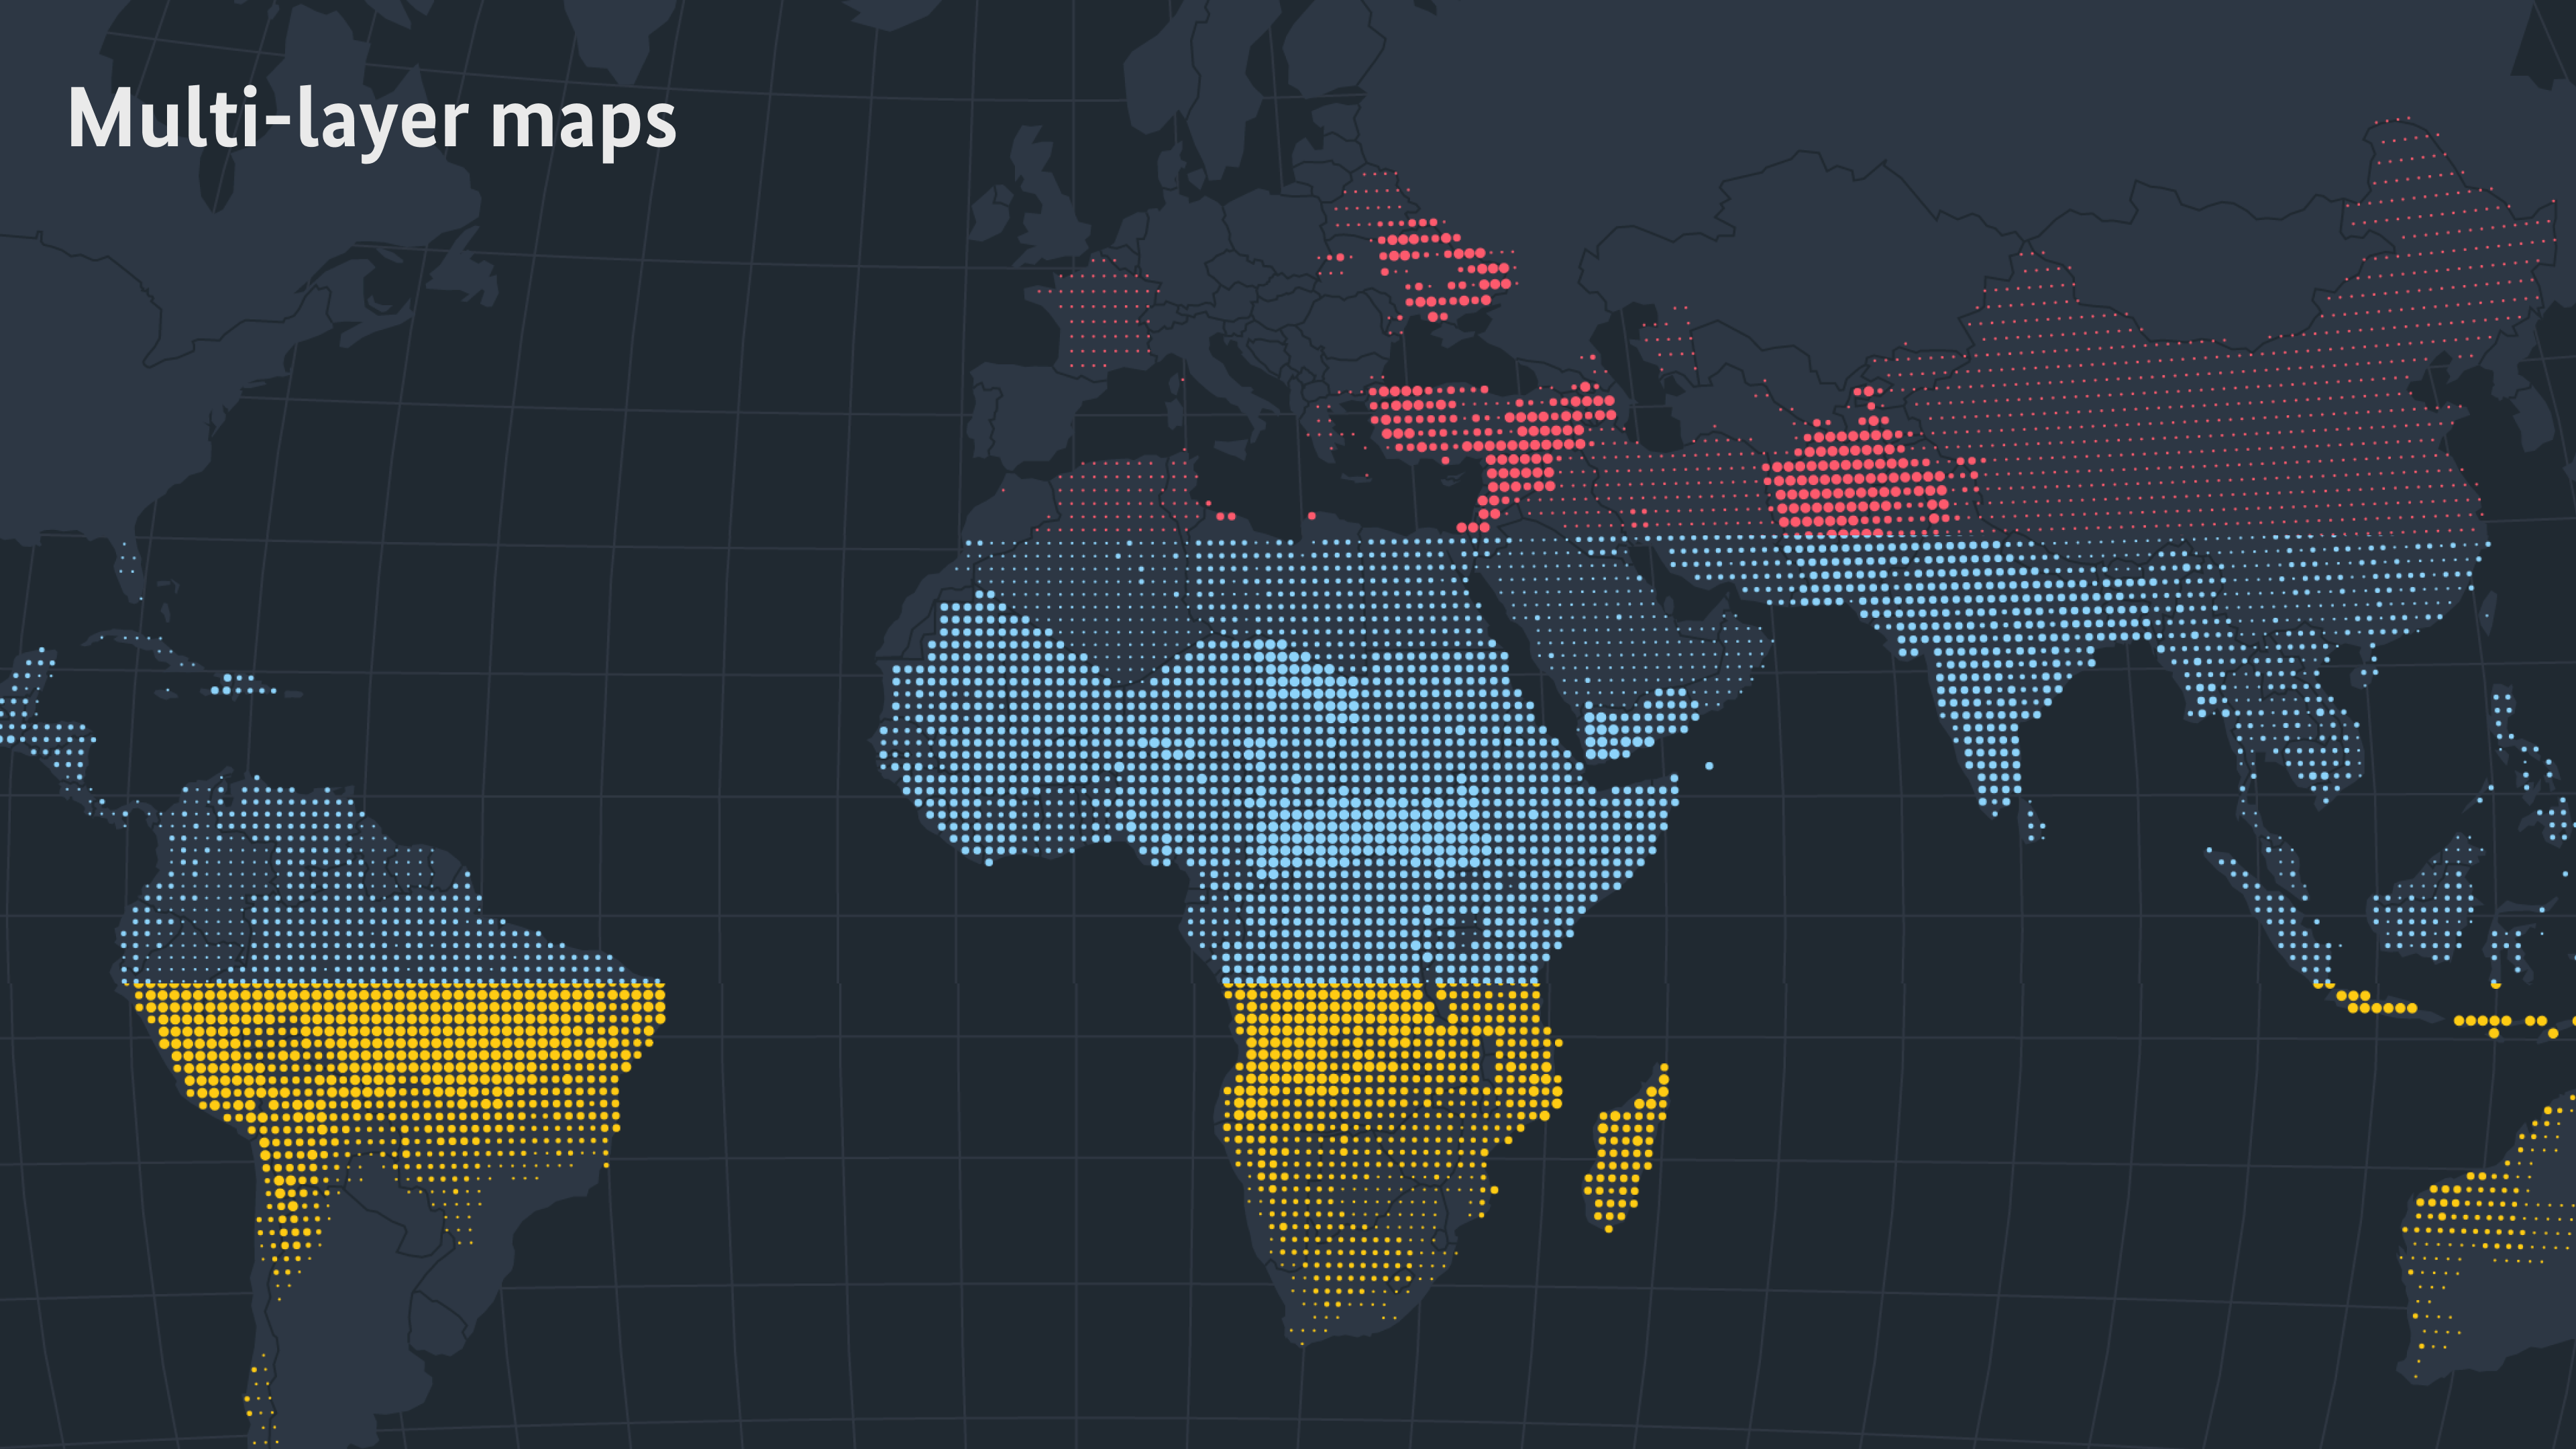
As a first publicly visible output, we produced a web application that introduces the topic and methodology, helps to identify global hotspots and introduces a concrete case study.

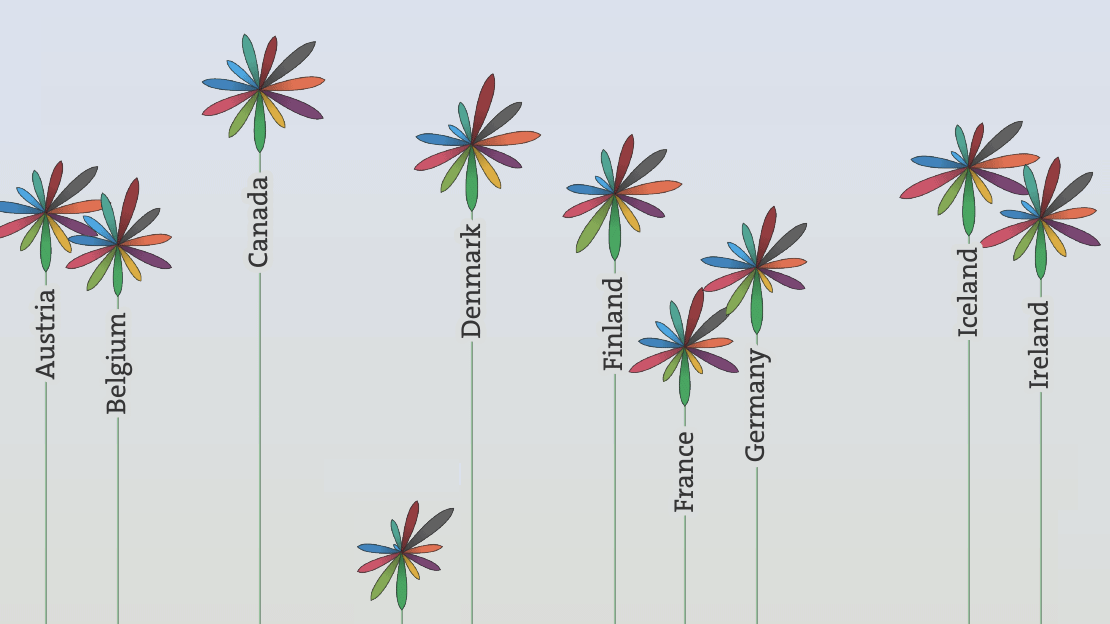
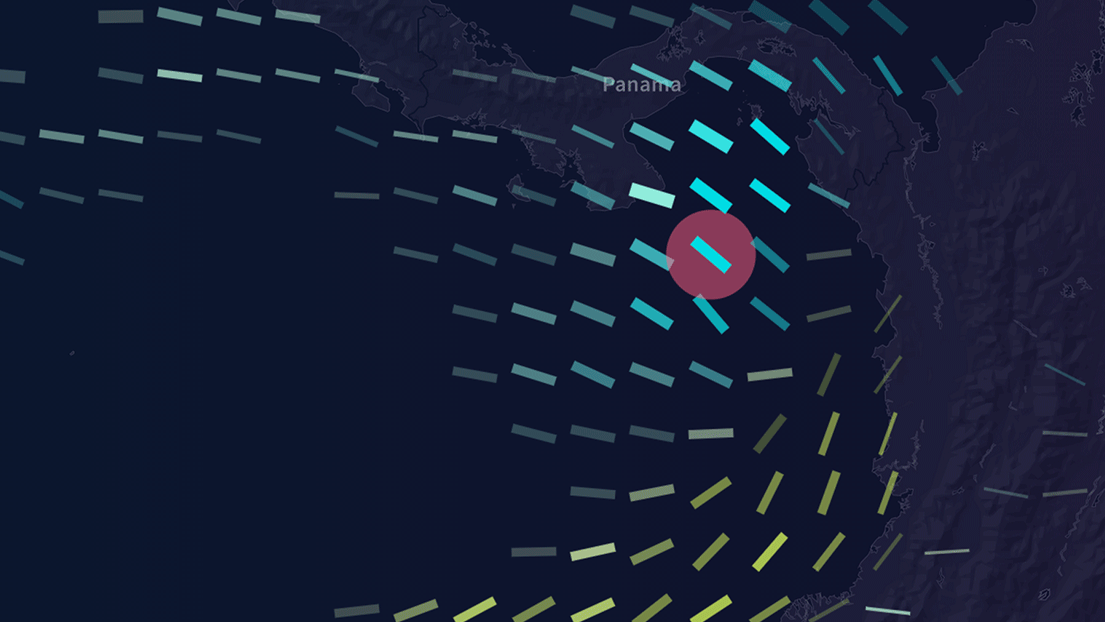
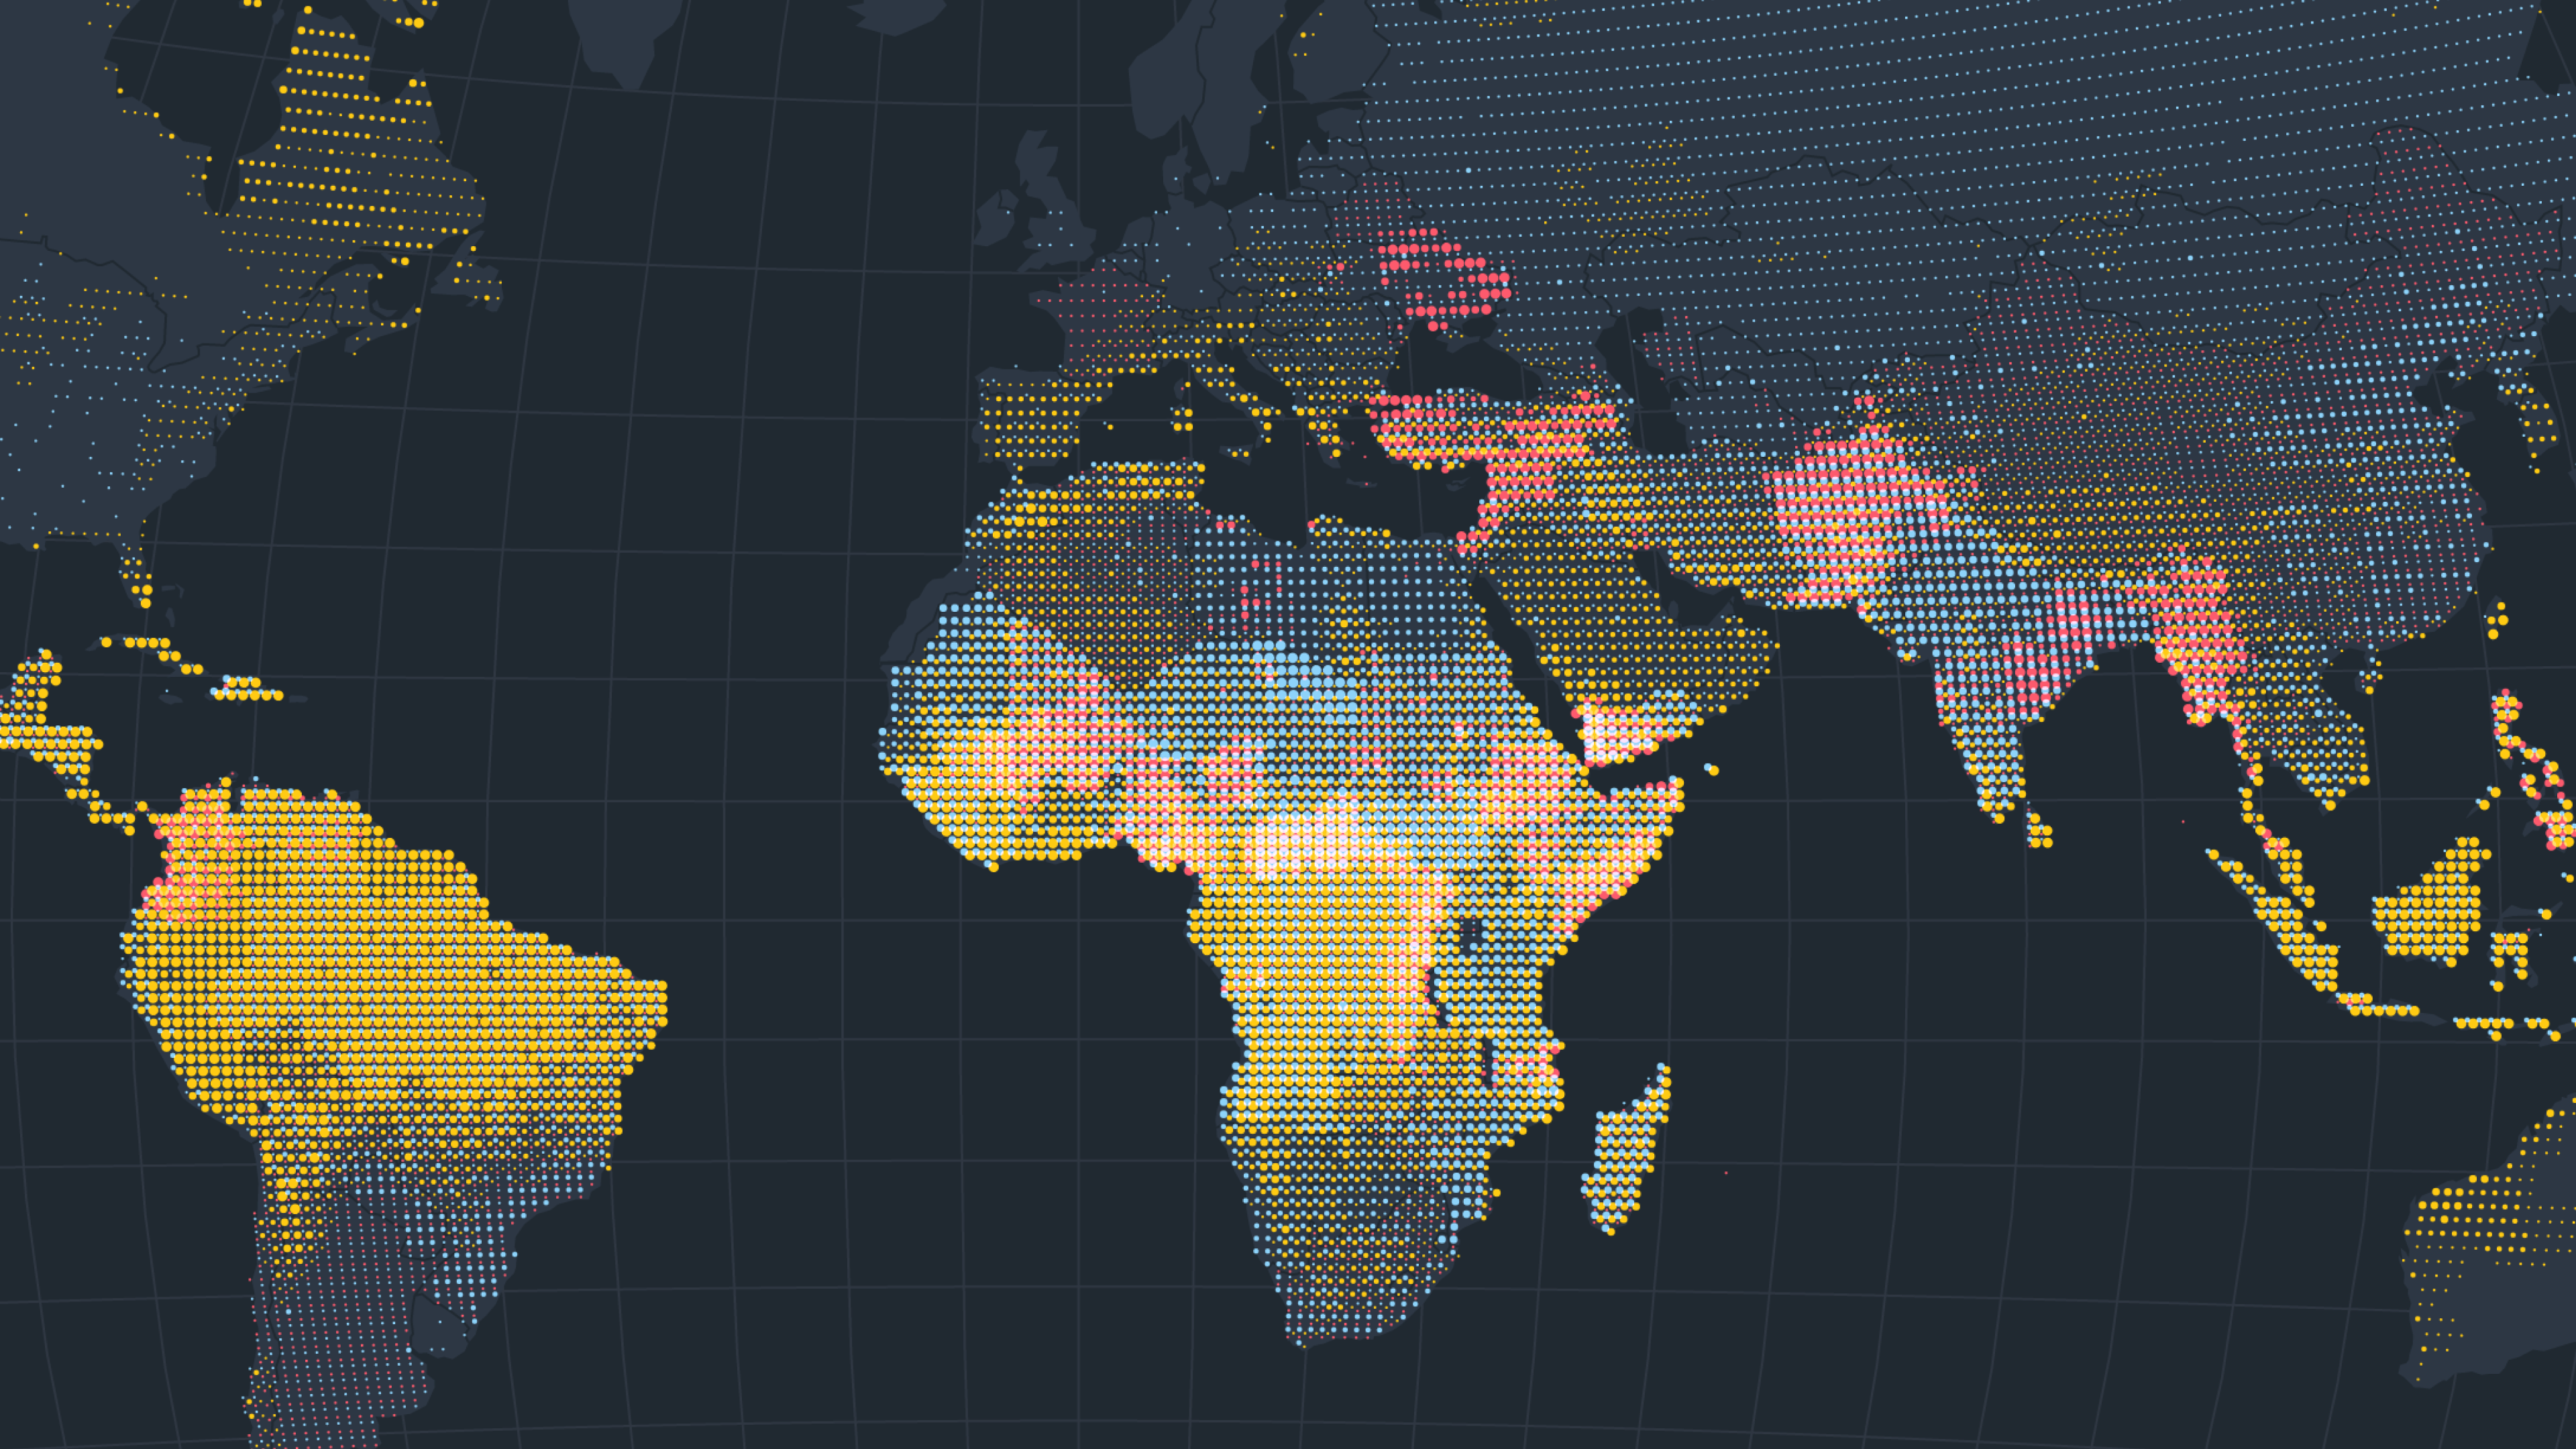
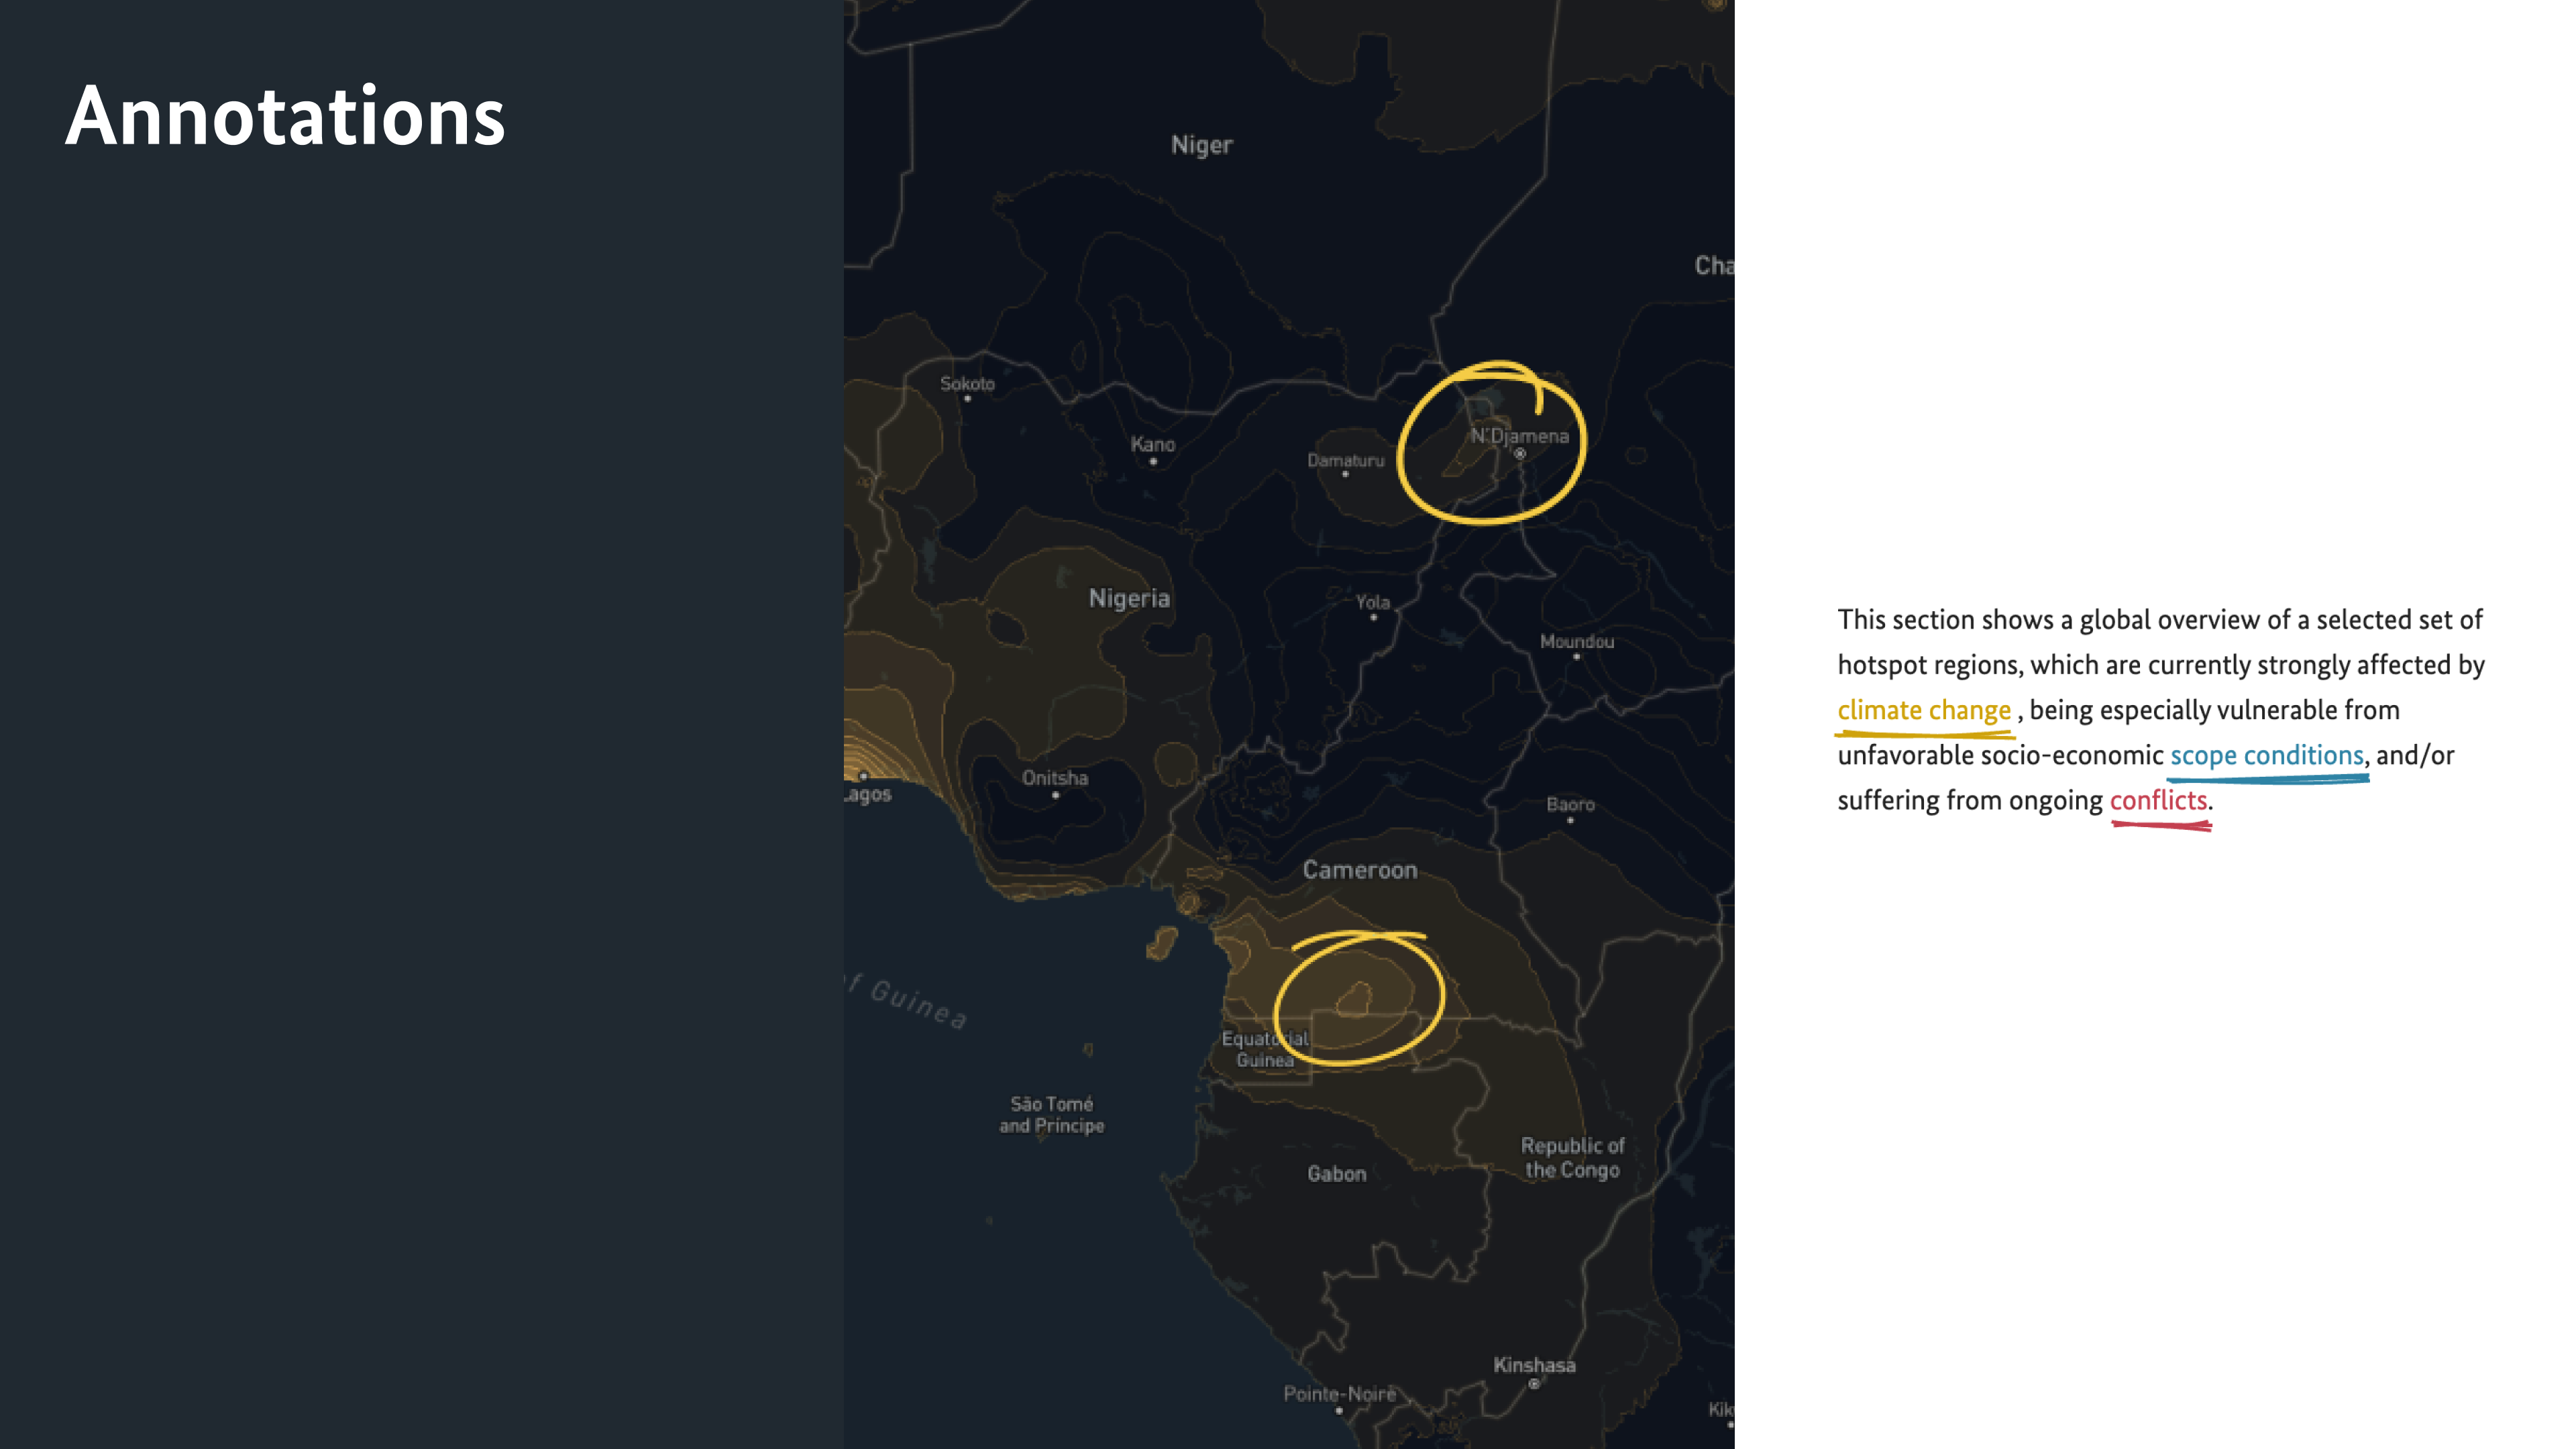
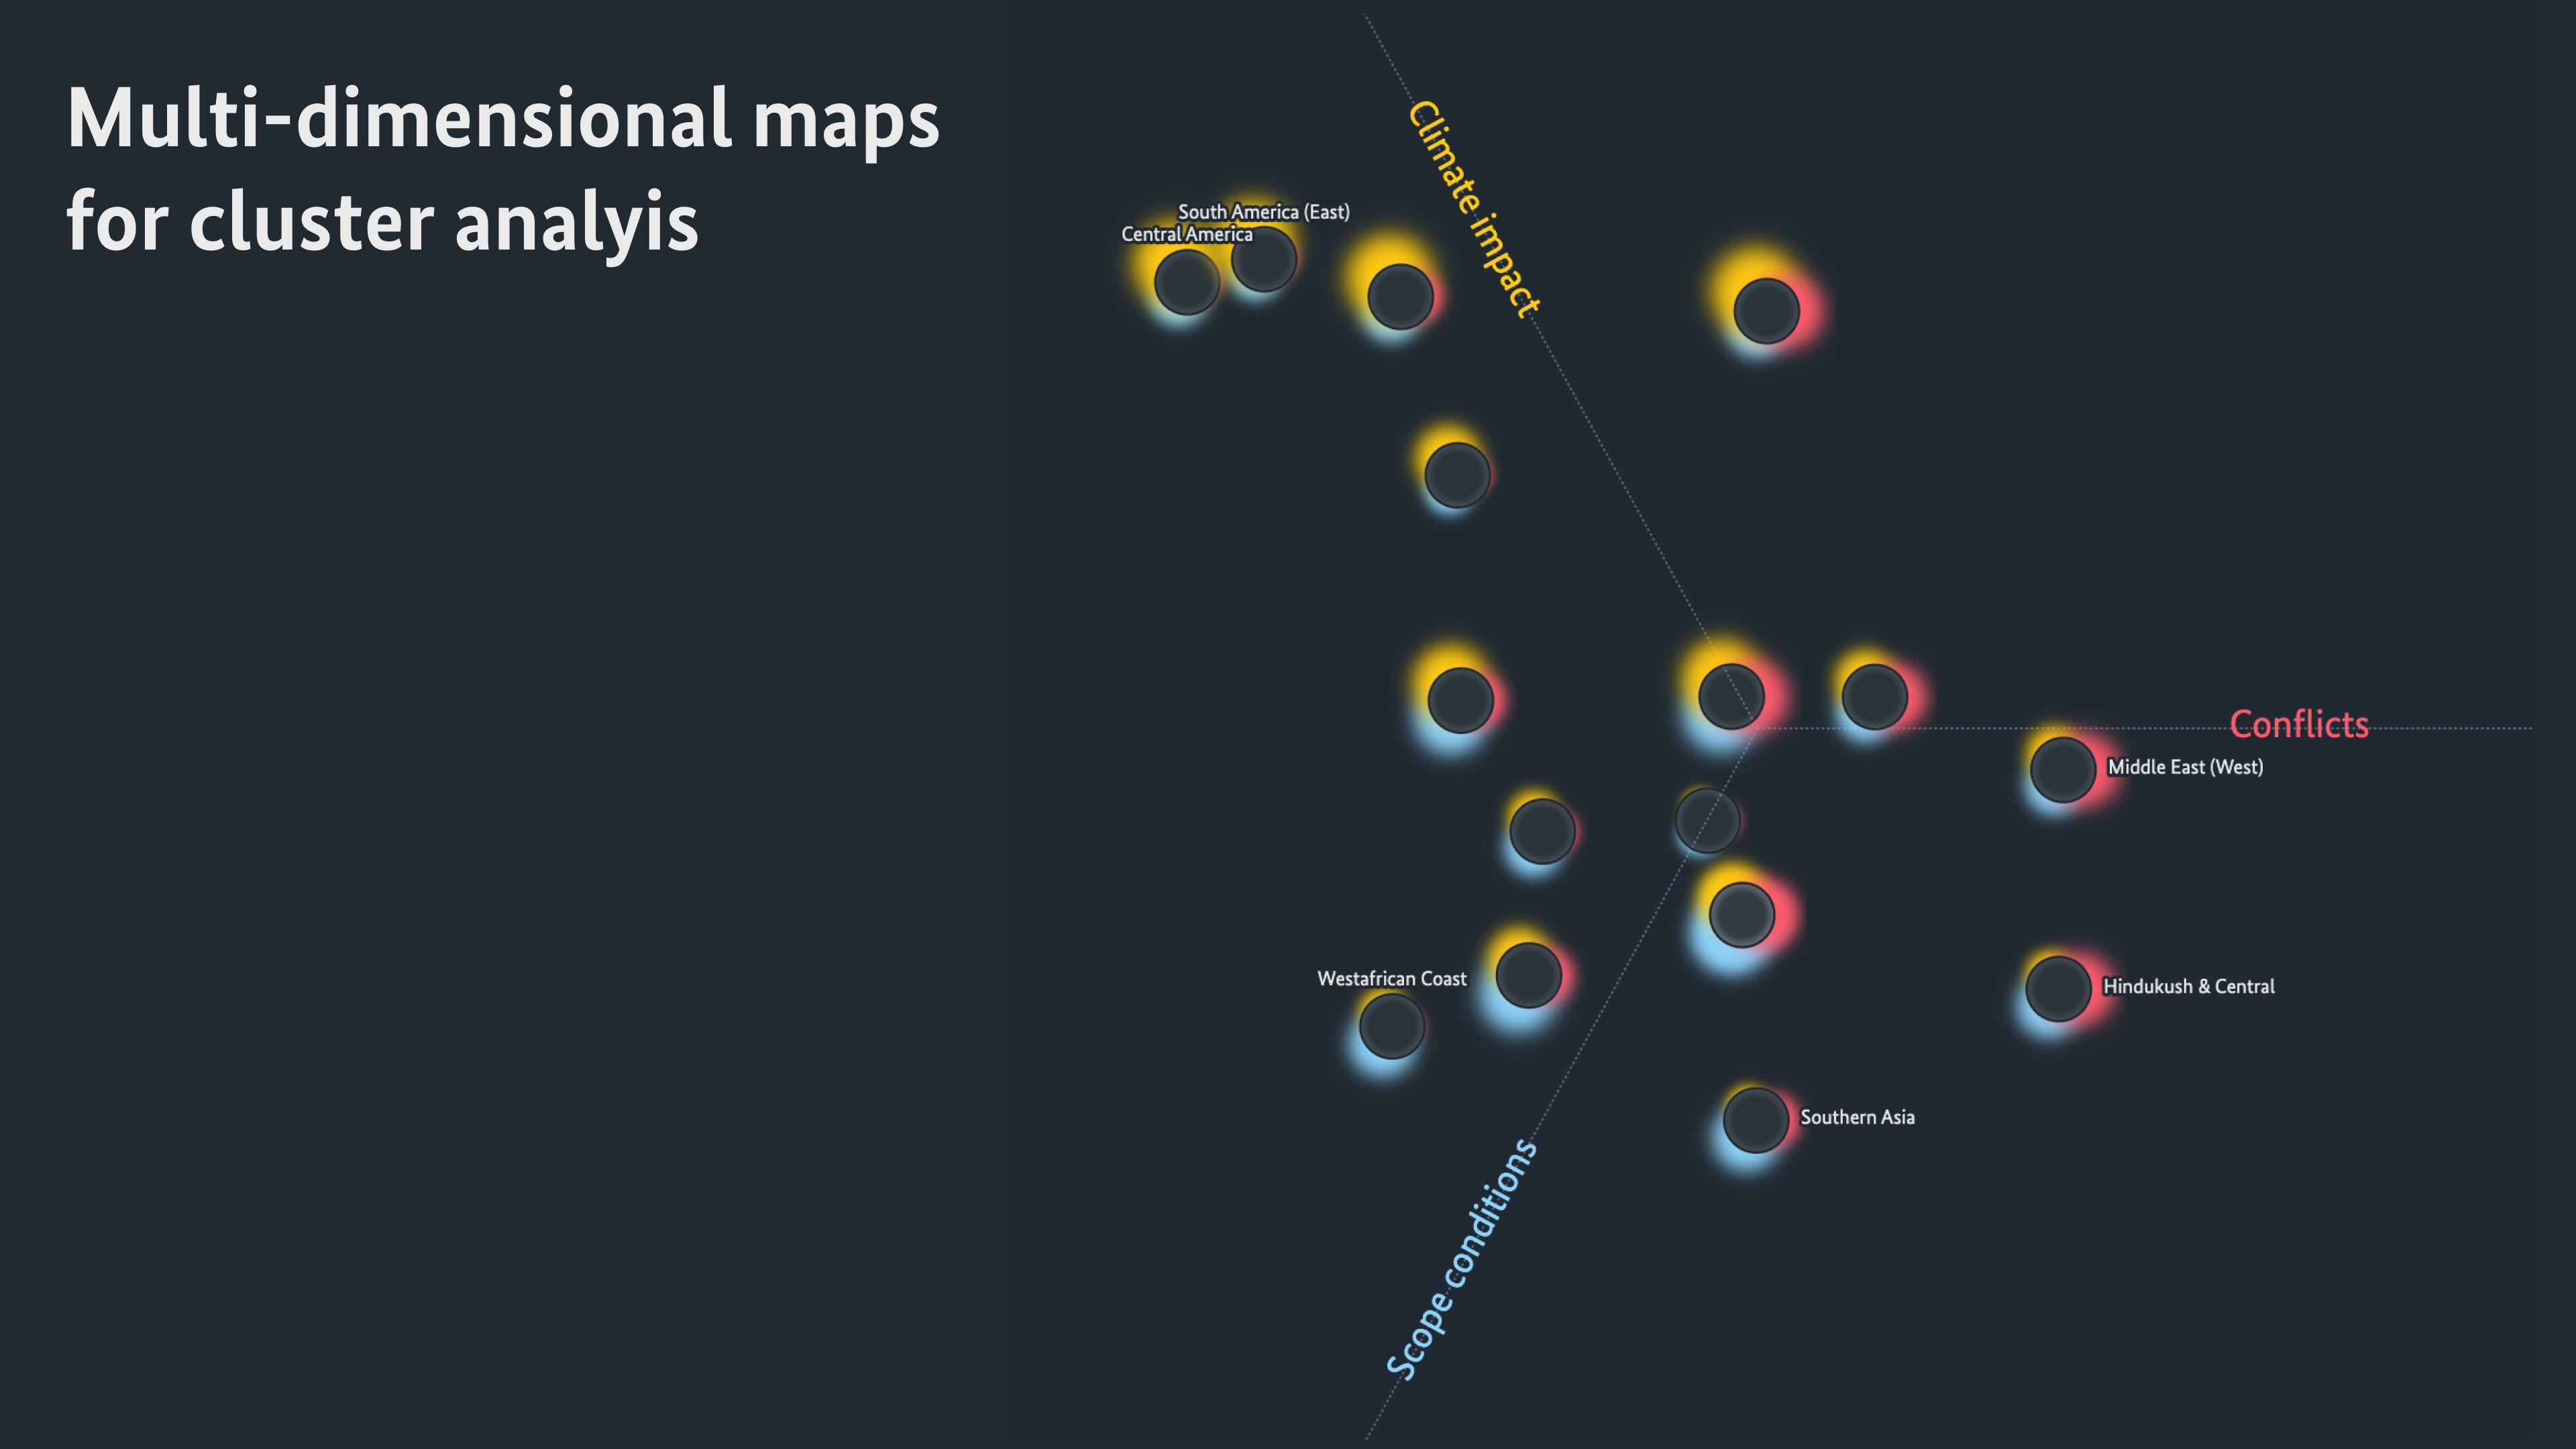
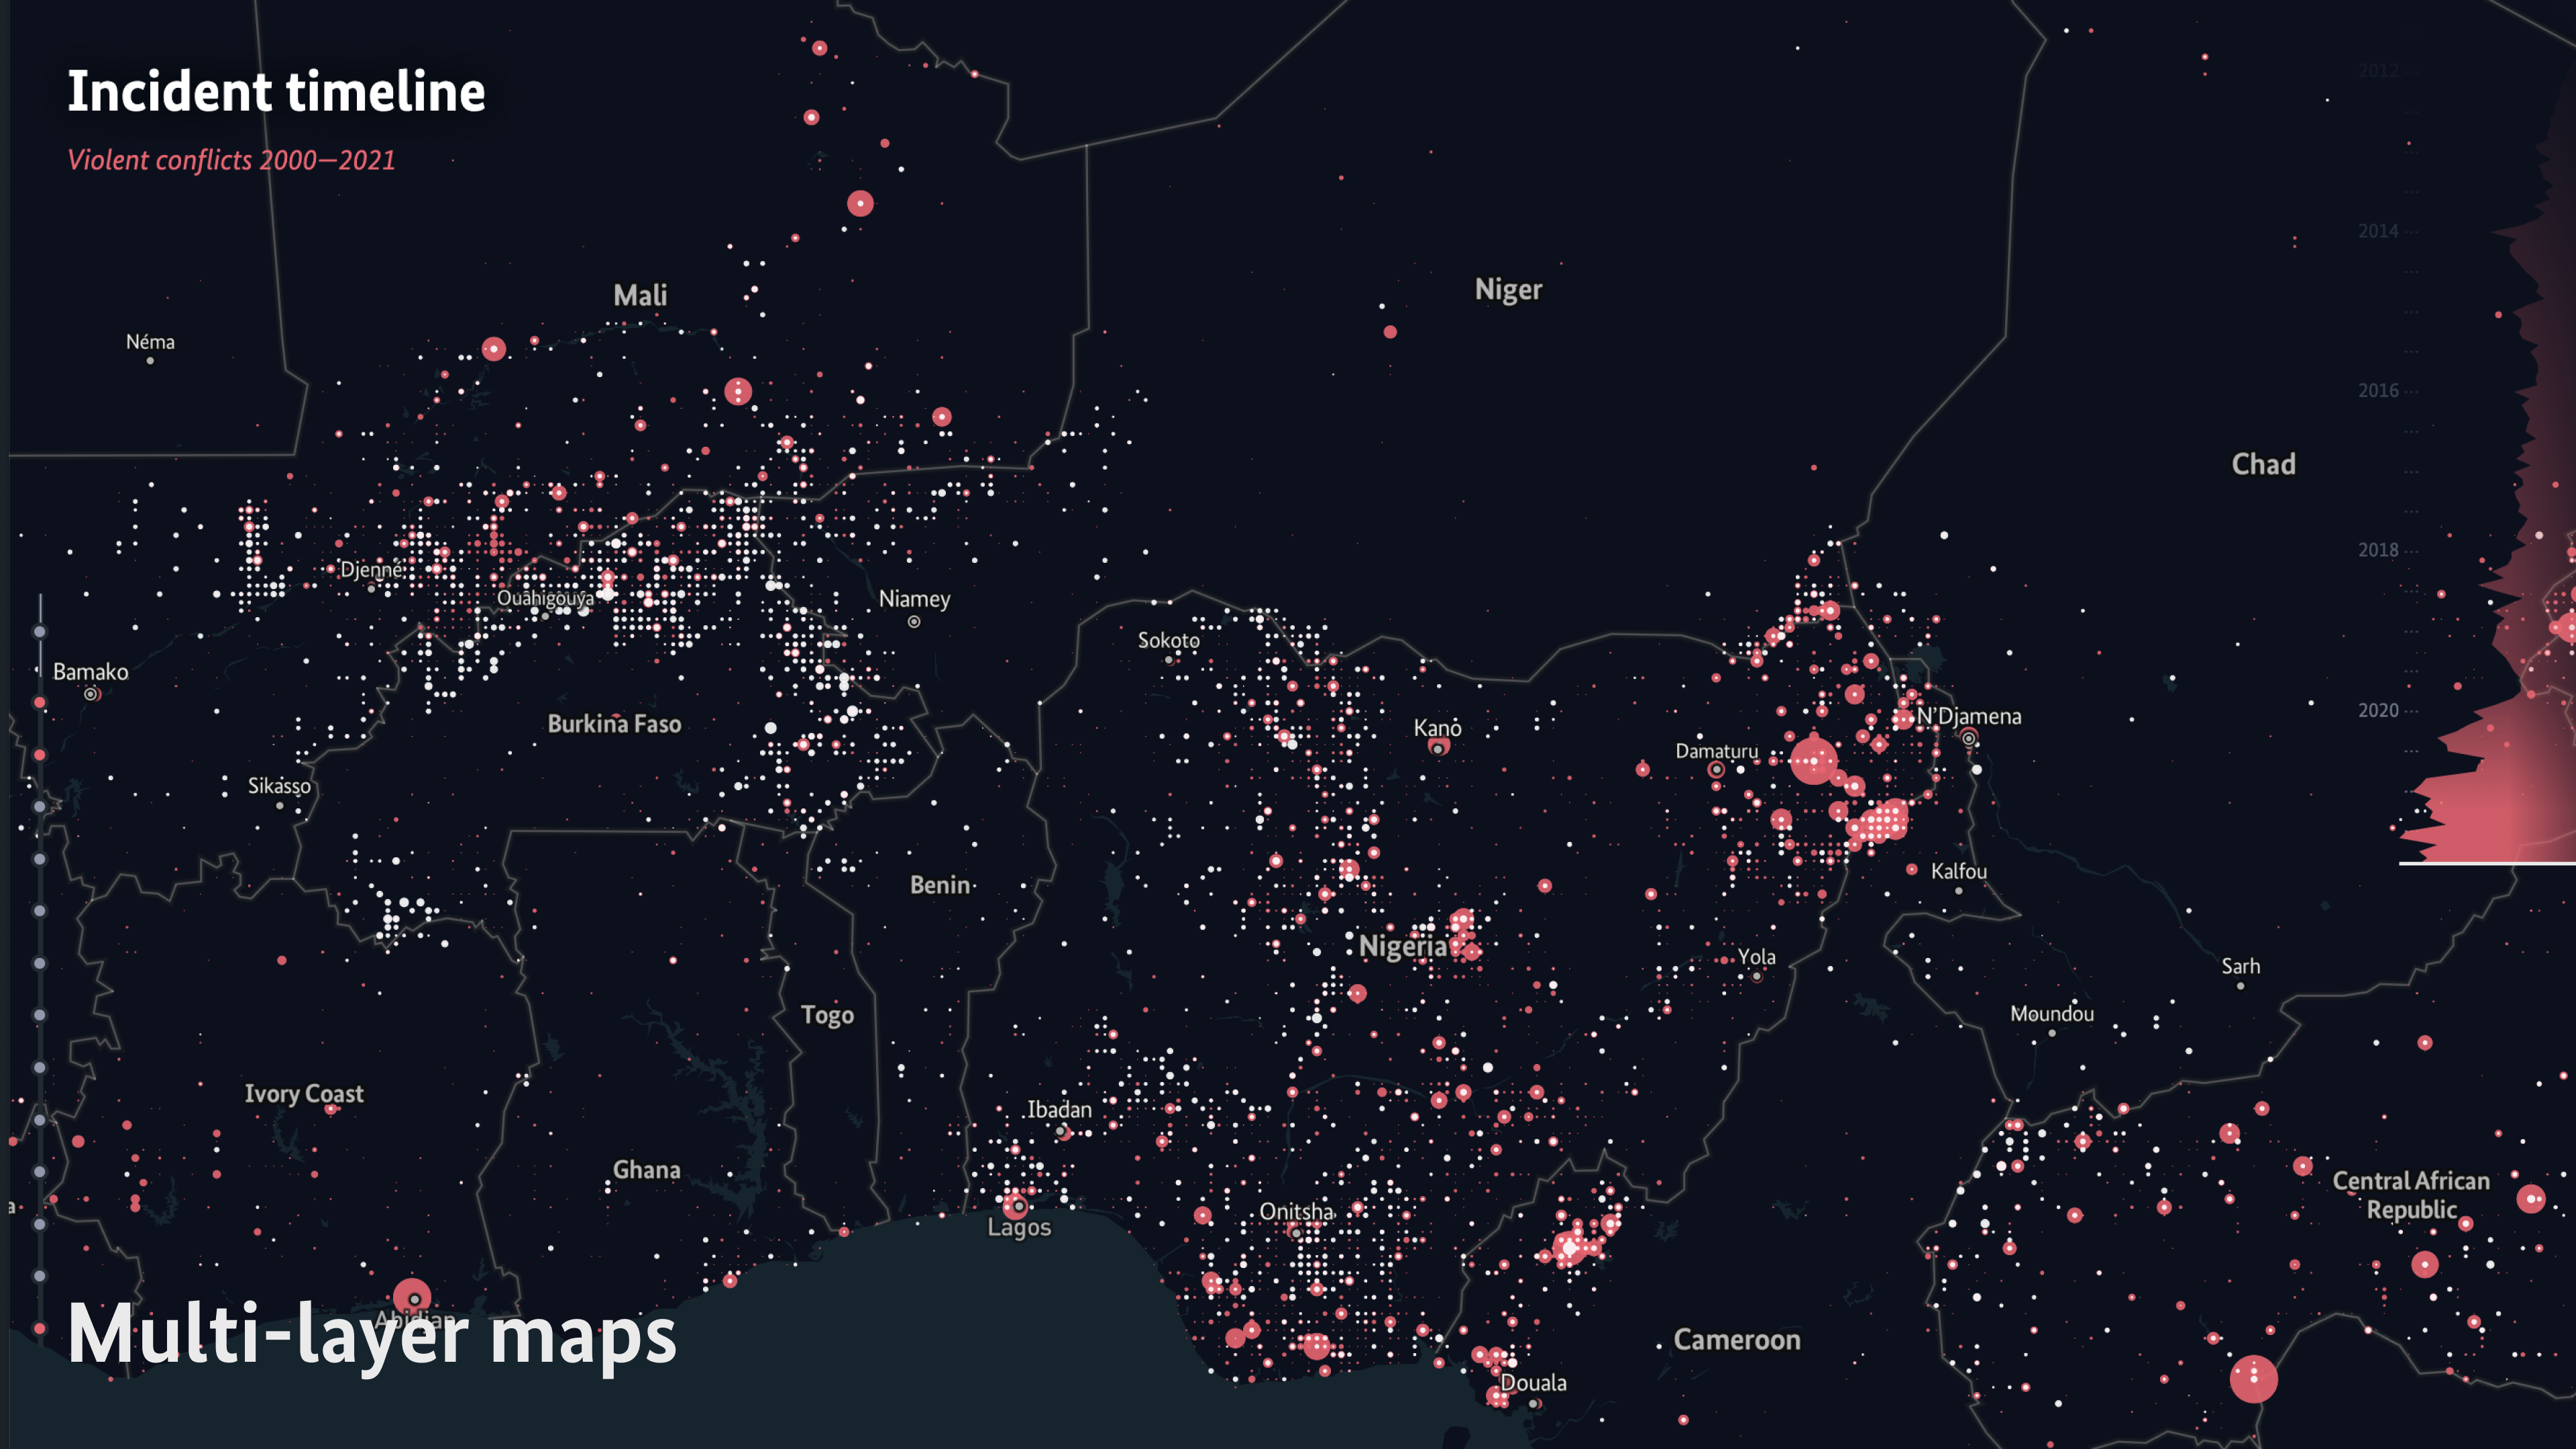
A key piece is the global multi-layer map, which shows the overlaps between climate impact, scope conditions (unfavorable conditions increasing the likelihood of conflict) and existing conflicts.
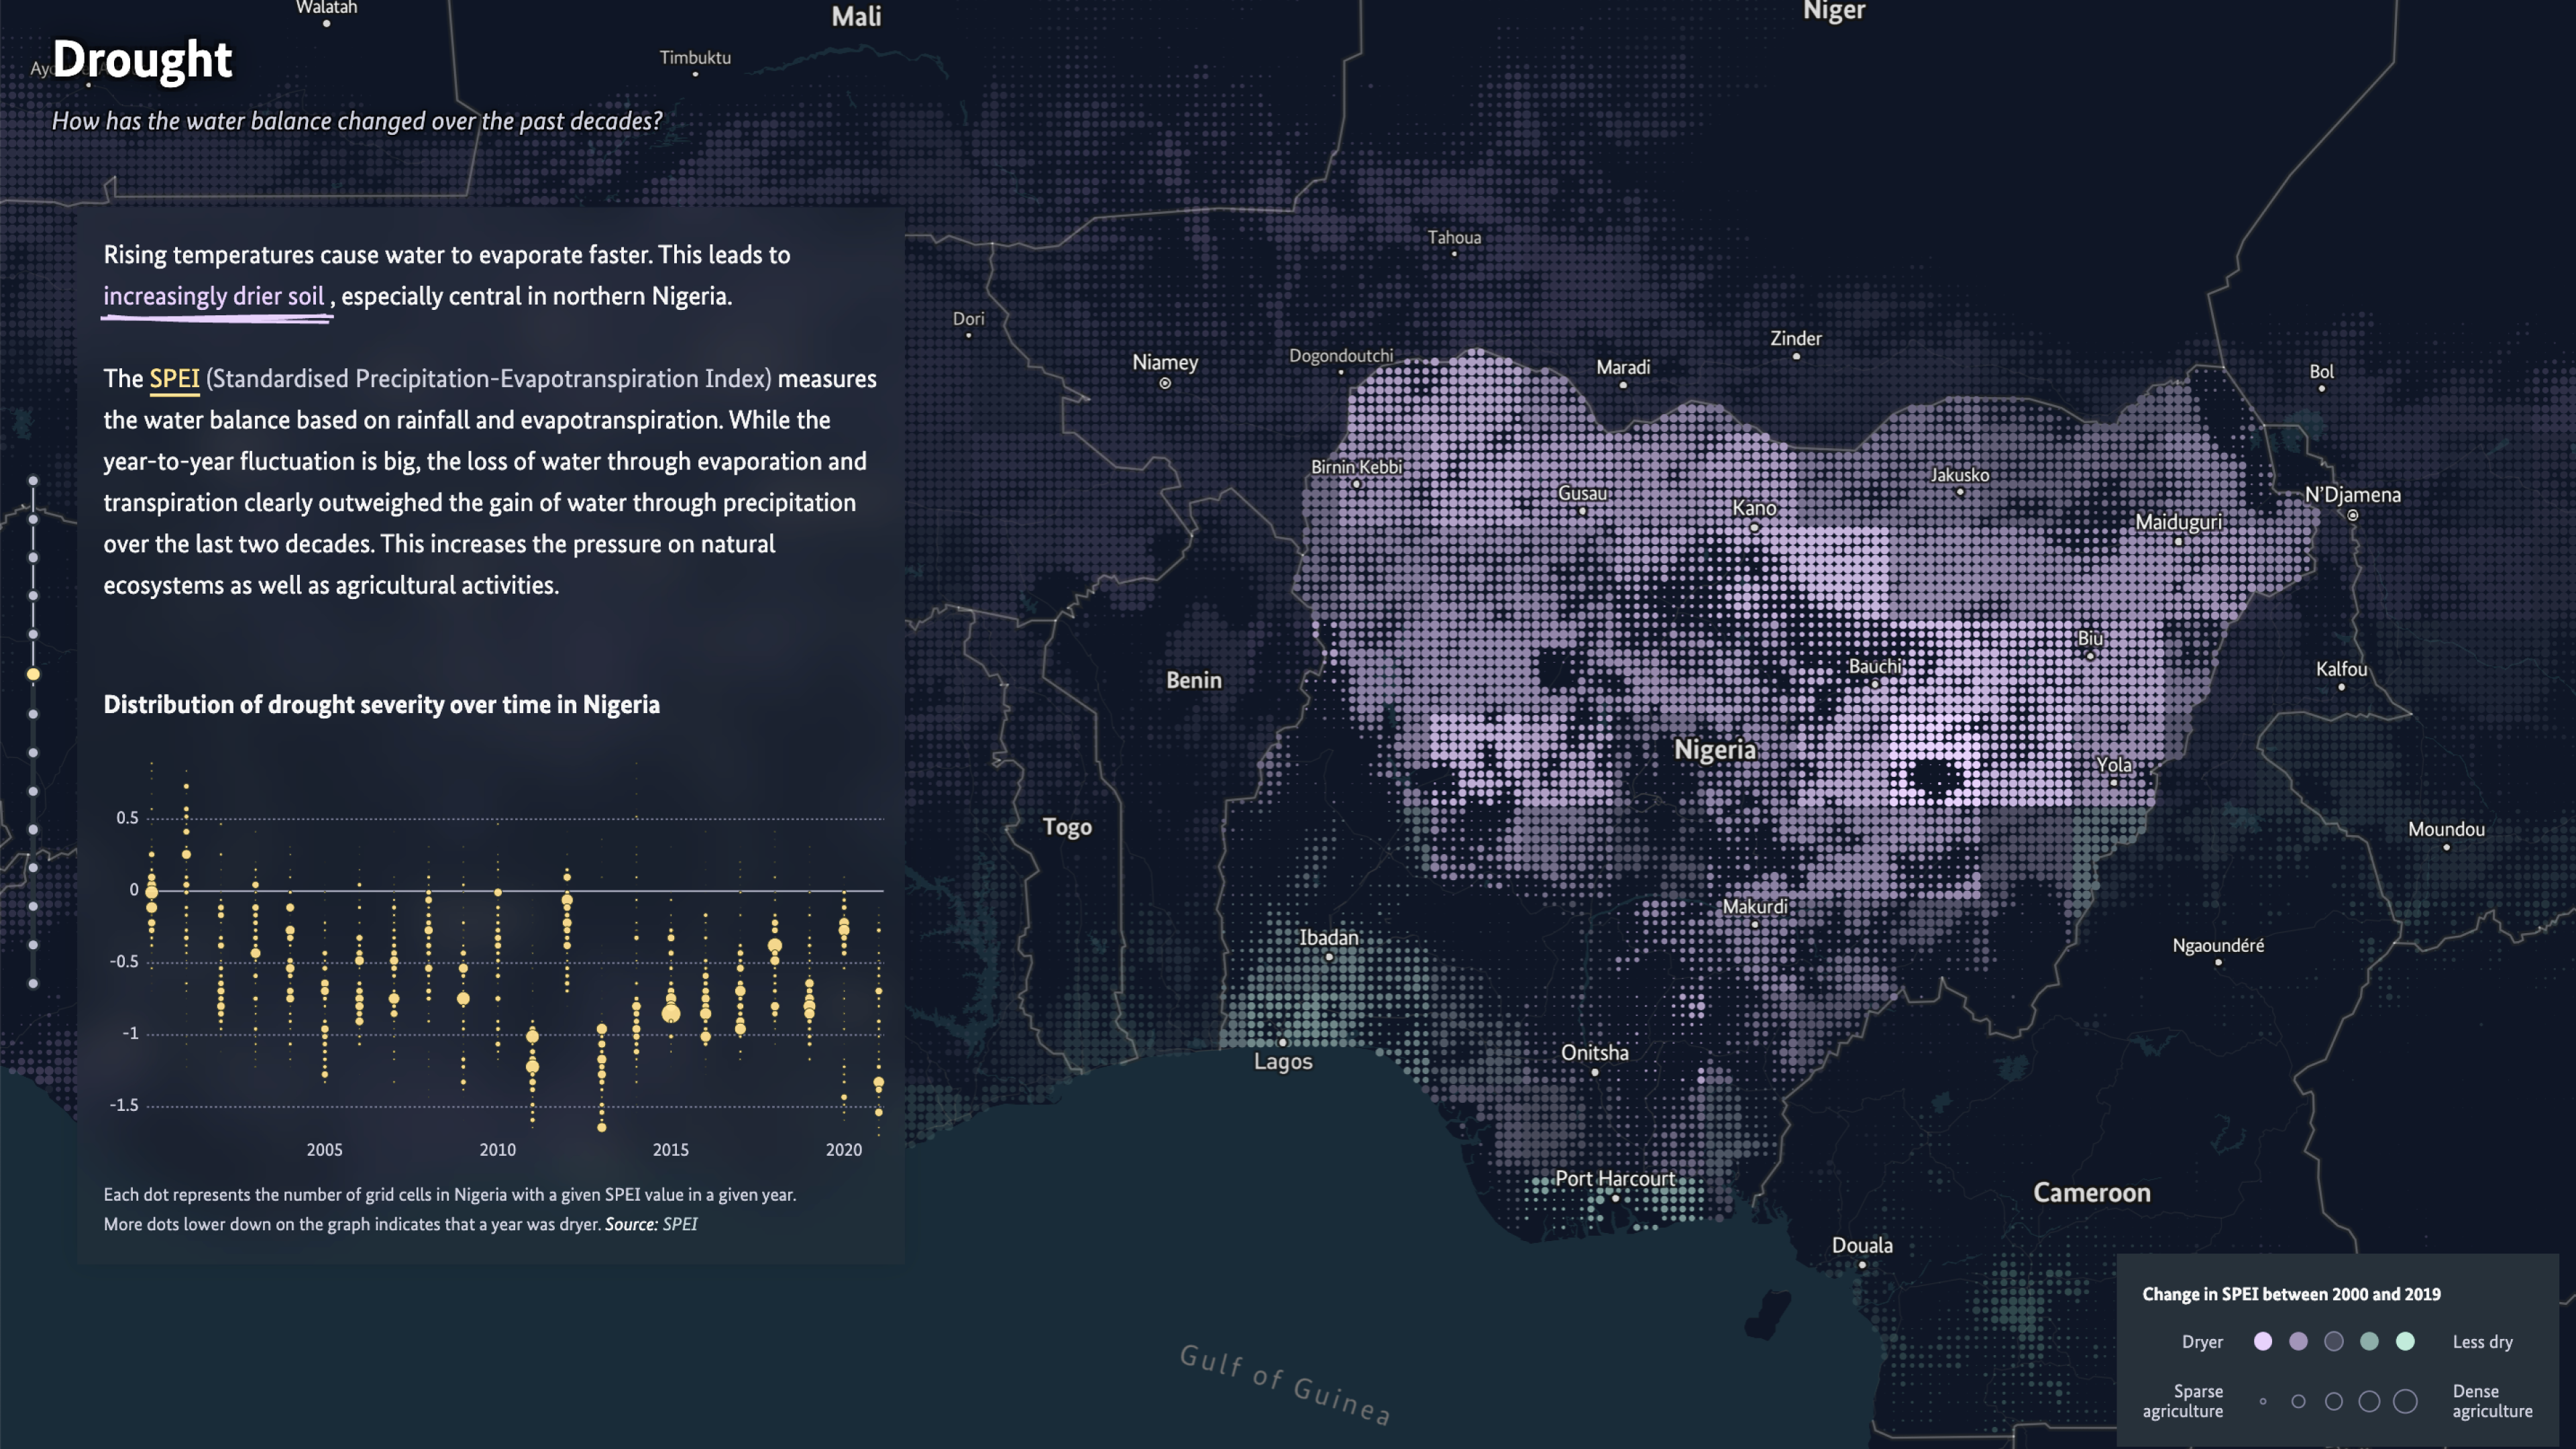
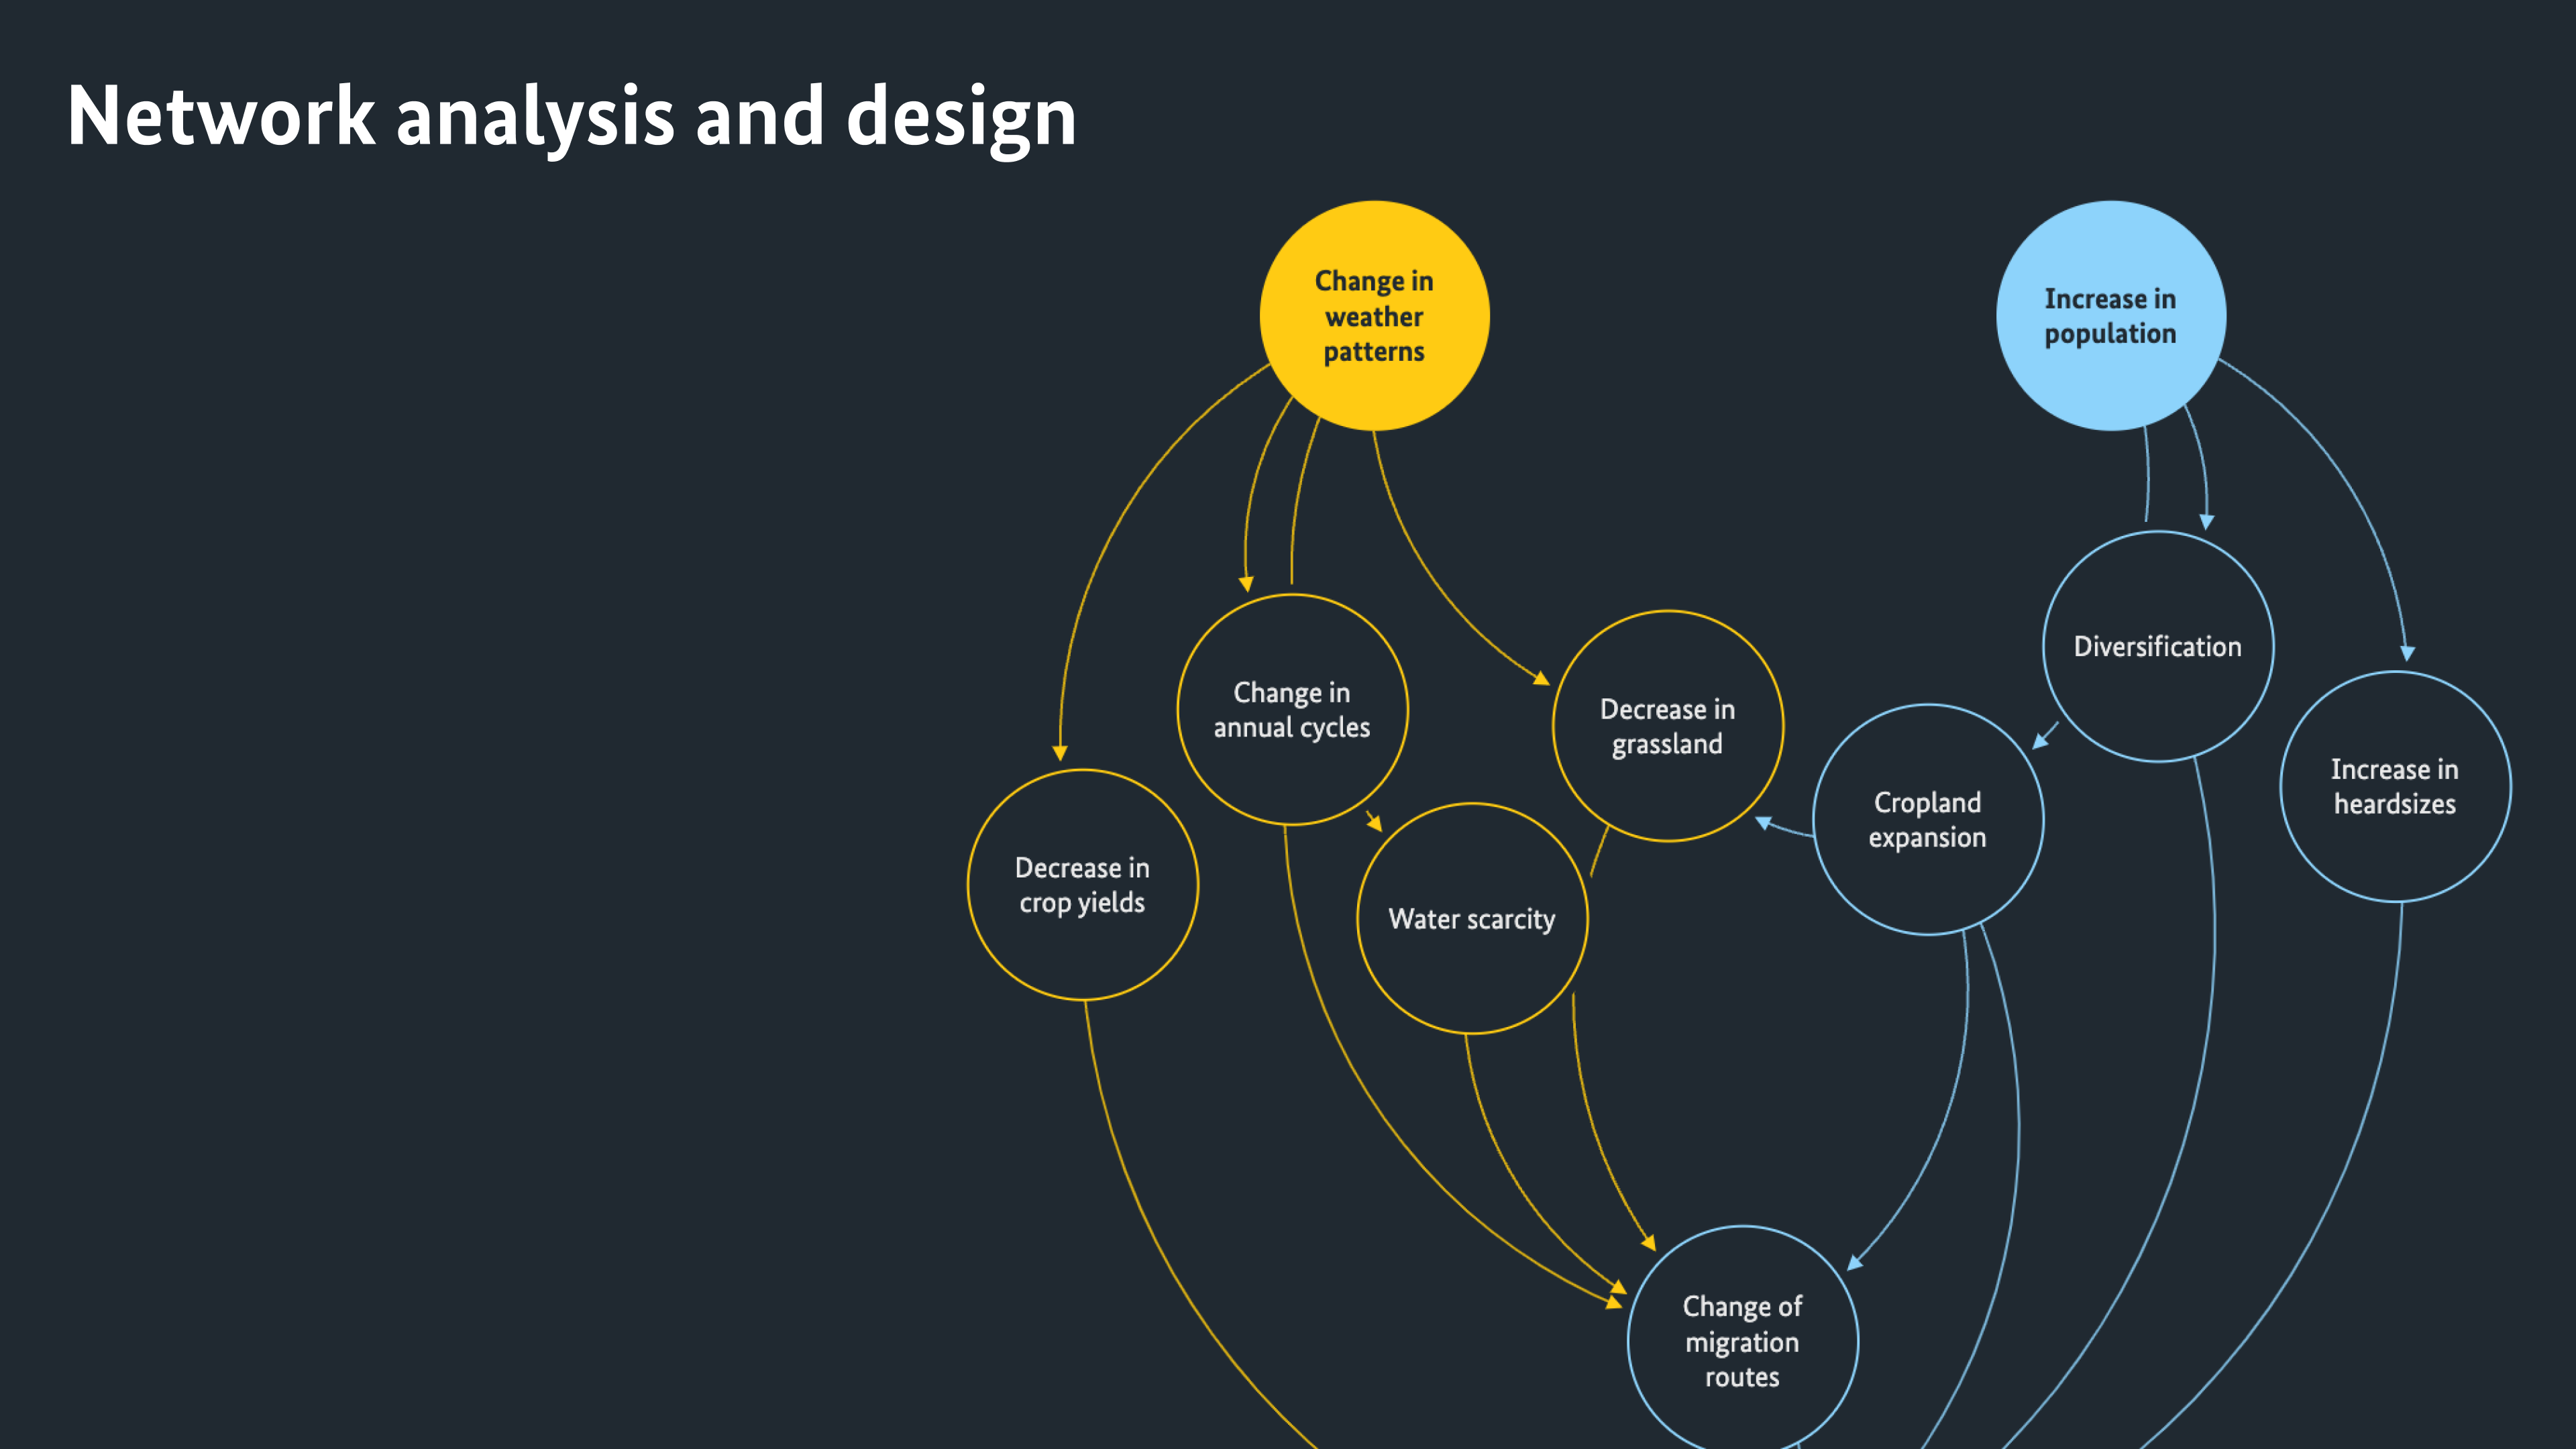
This global view is complemented by an in-depth case study: the farmer-herder conflicts in the Sahel region. By unfolding the layers of influence step-by-step, we can explain in detail how the long-term effects of climate change can have adverse effects in already conflict ridden regions, or might even spark new conflicts.

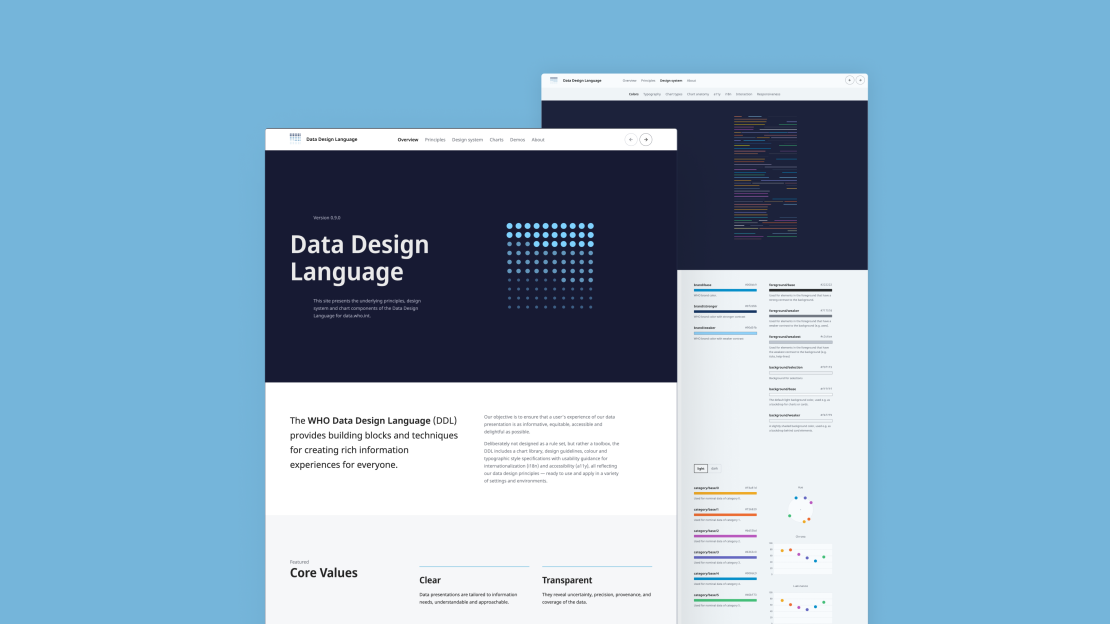
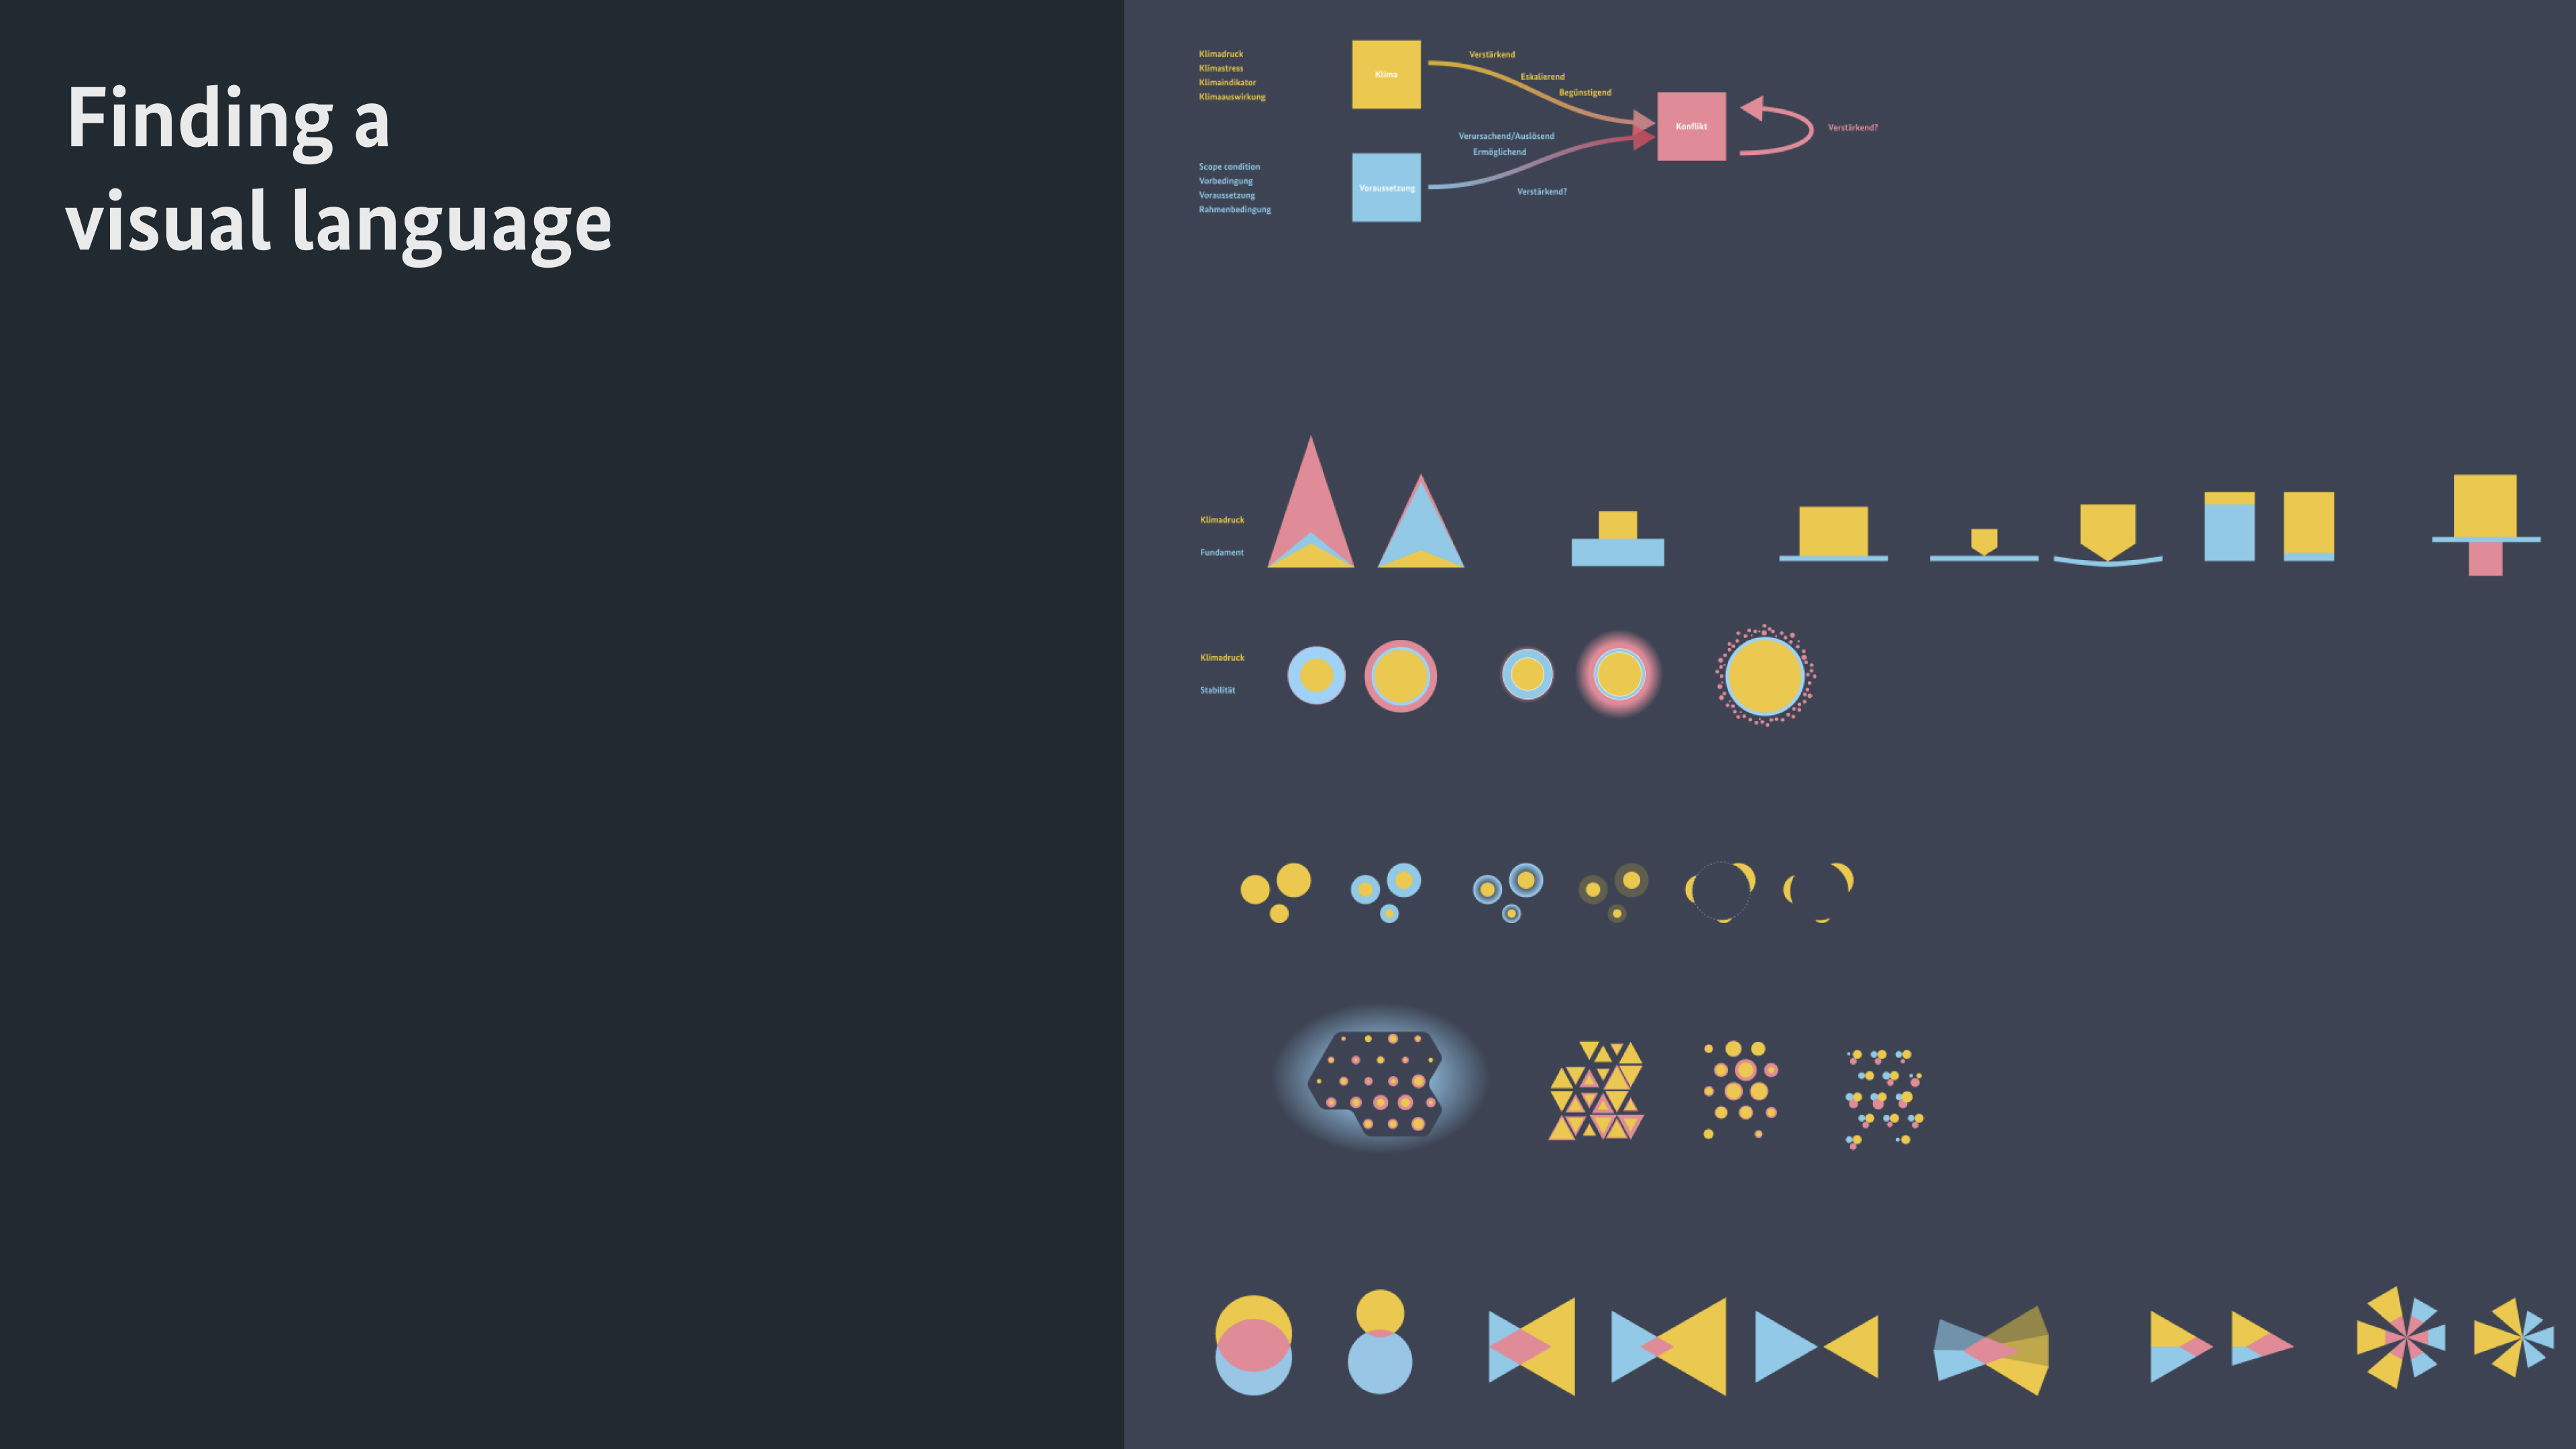
Data Design Language
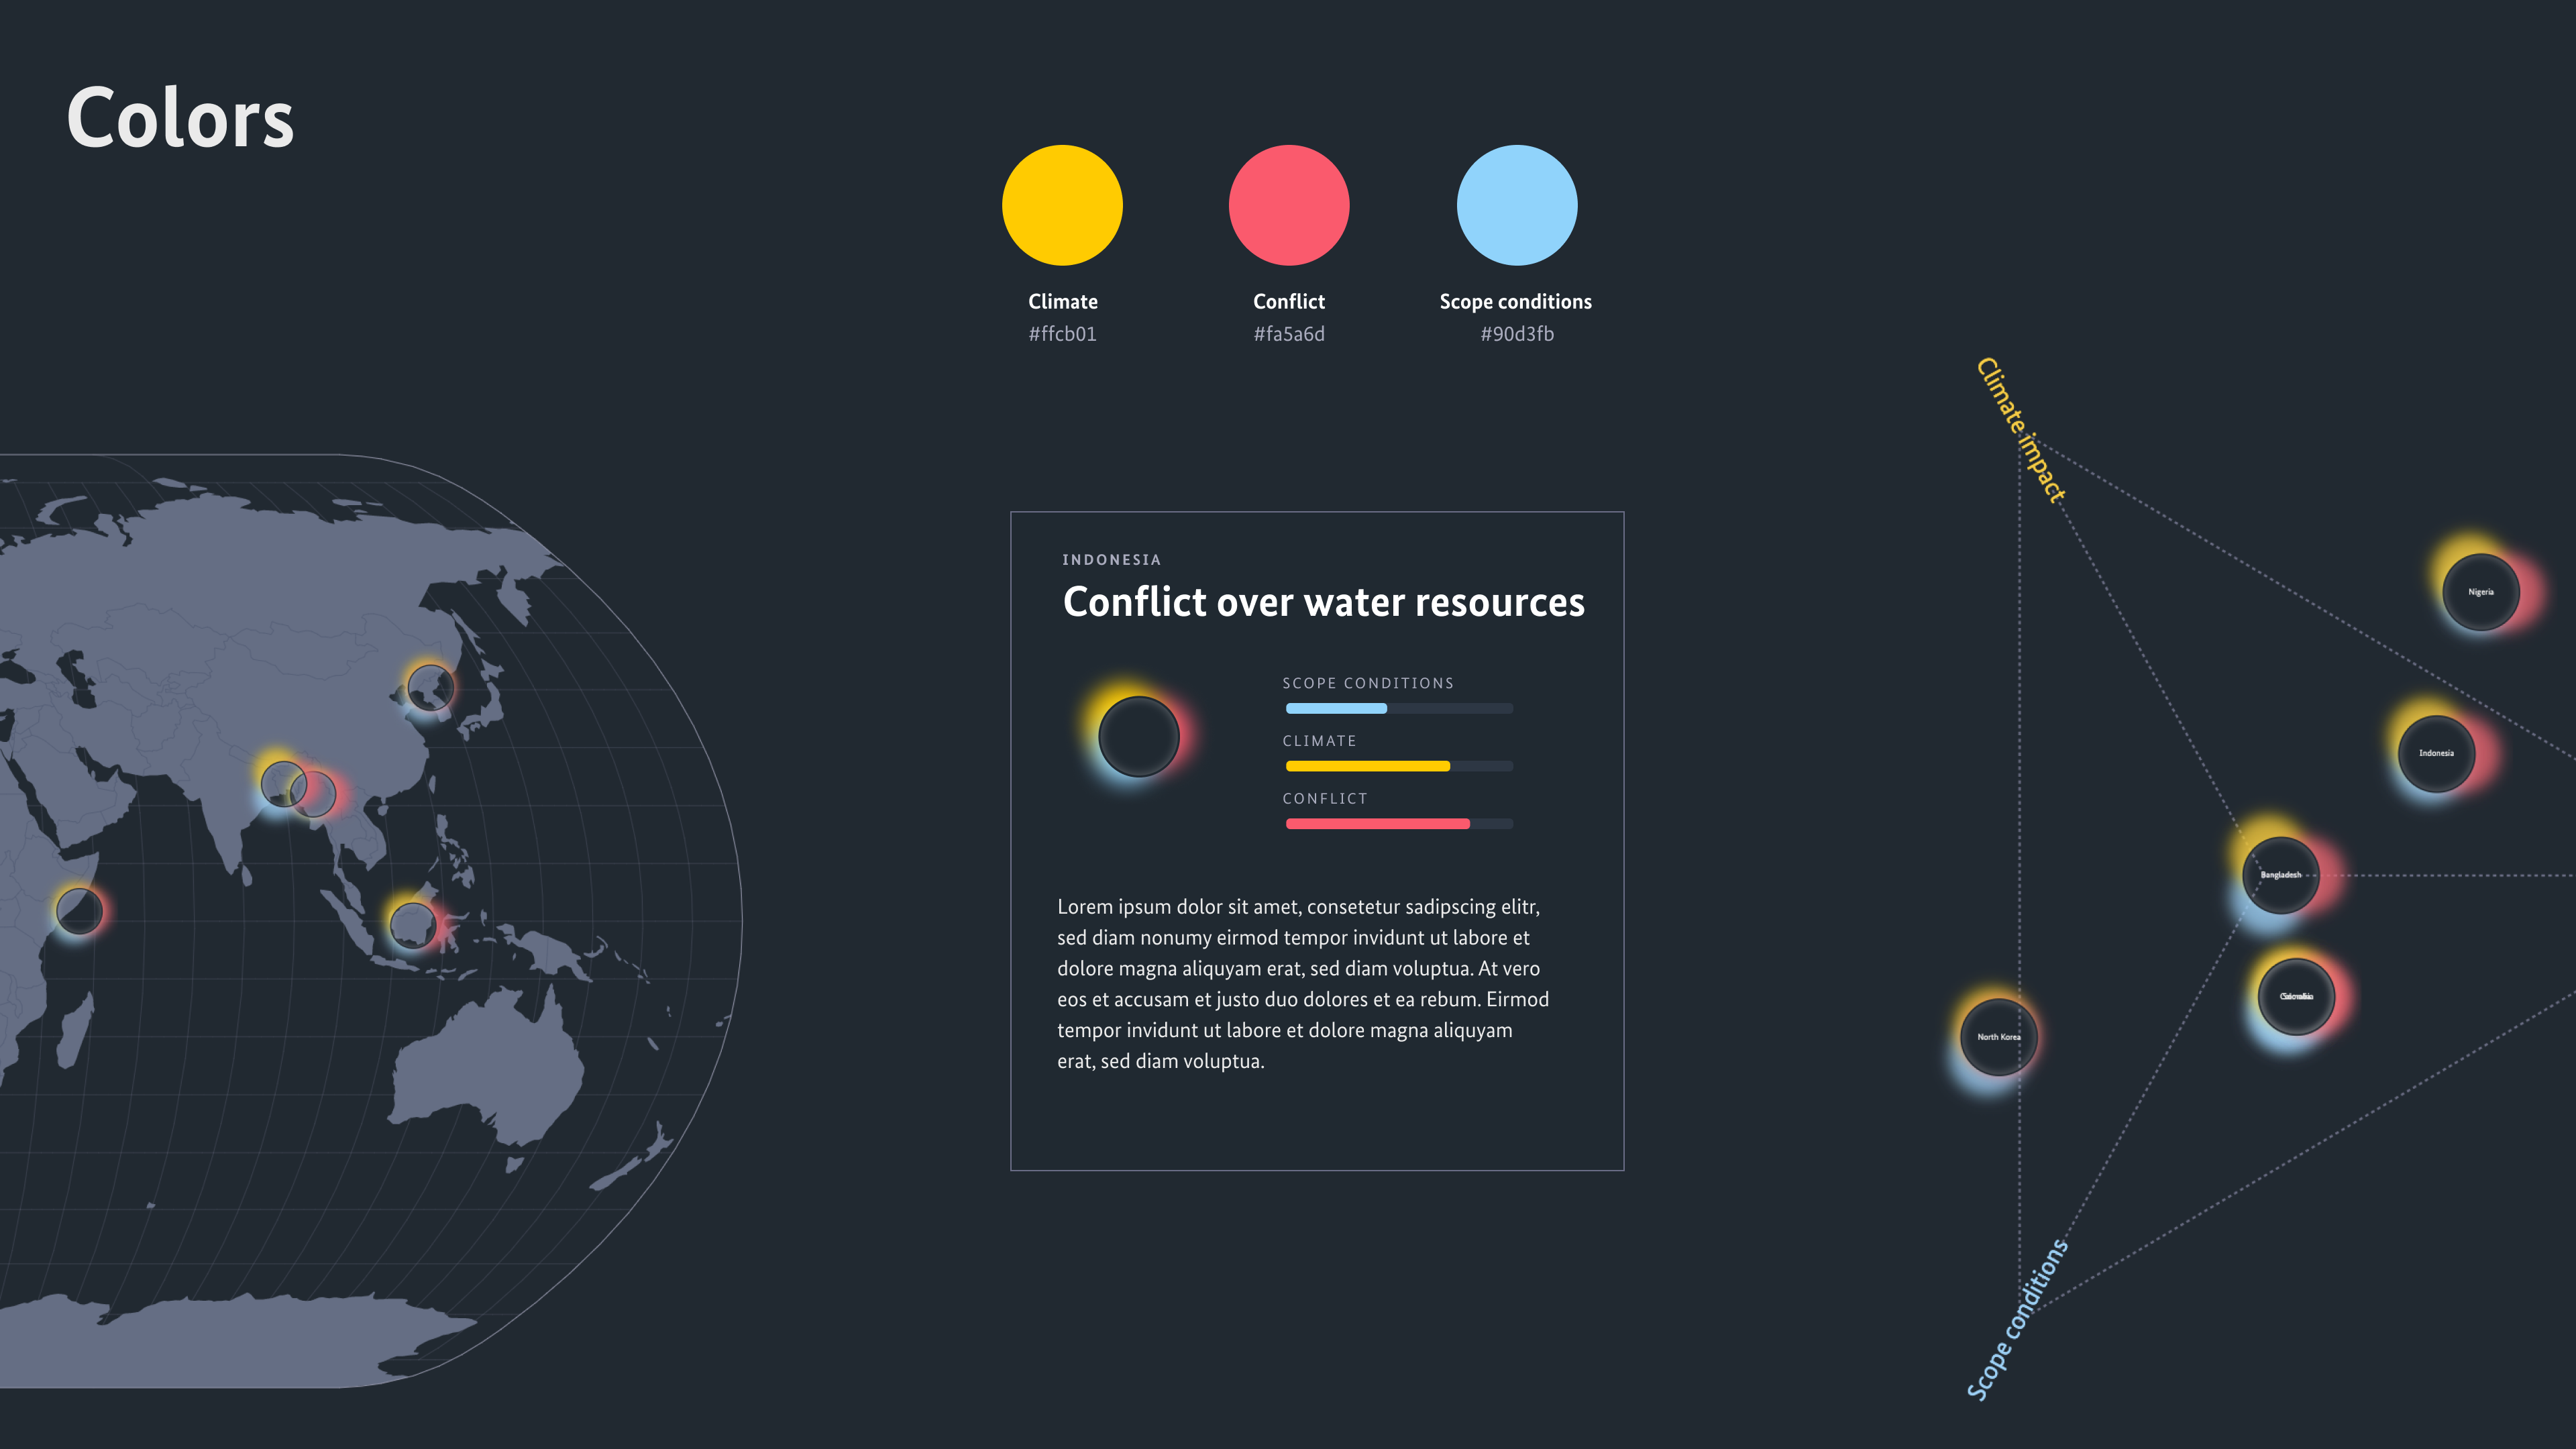
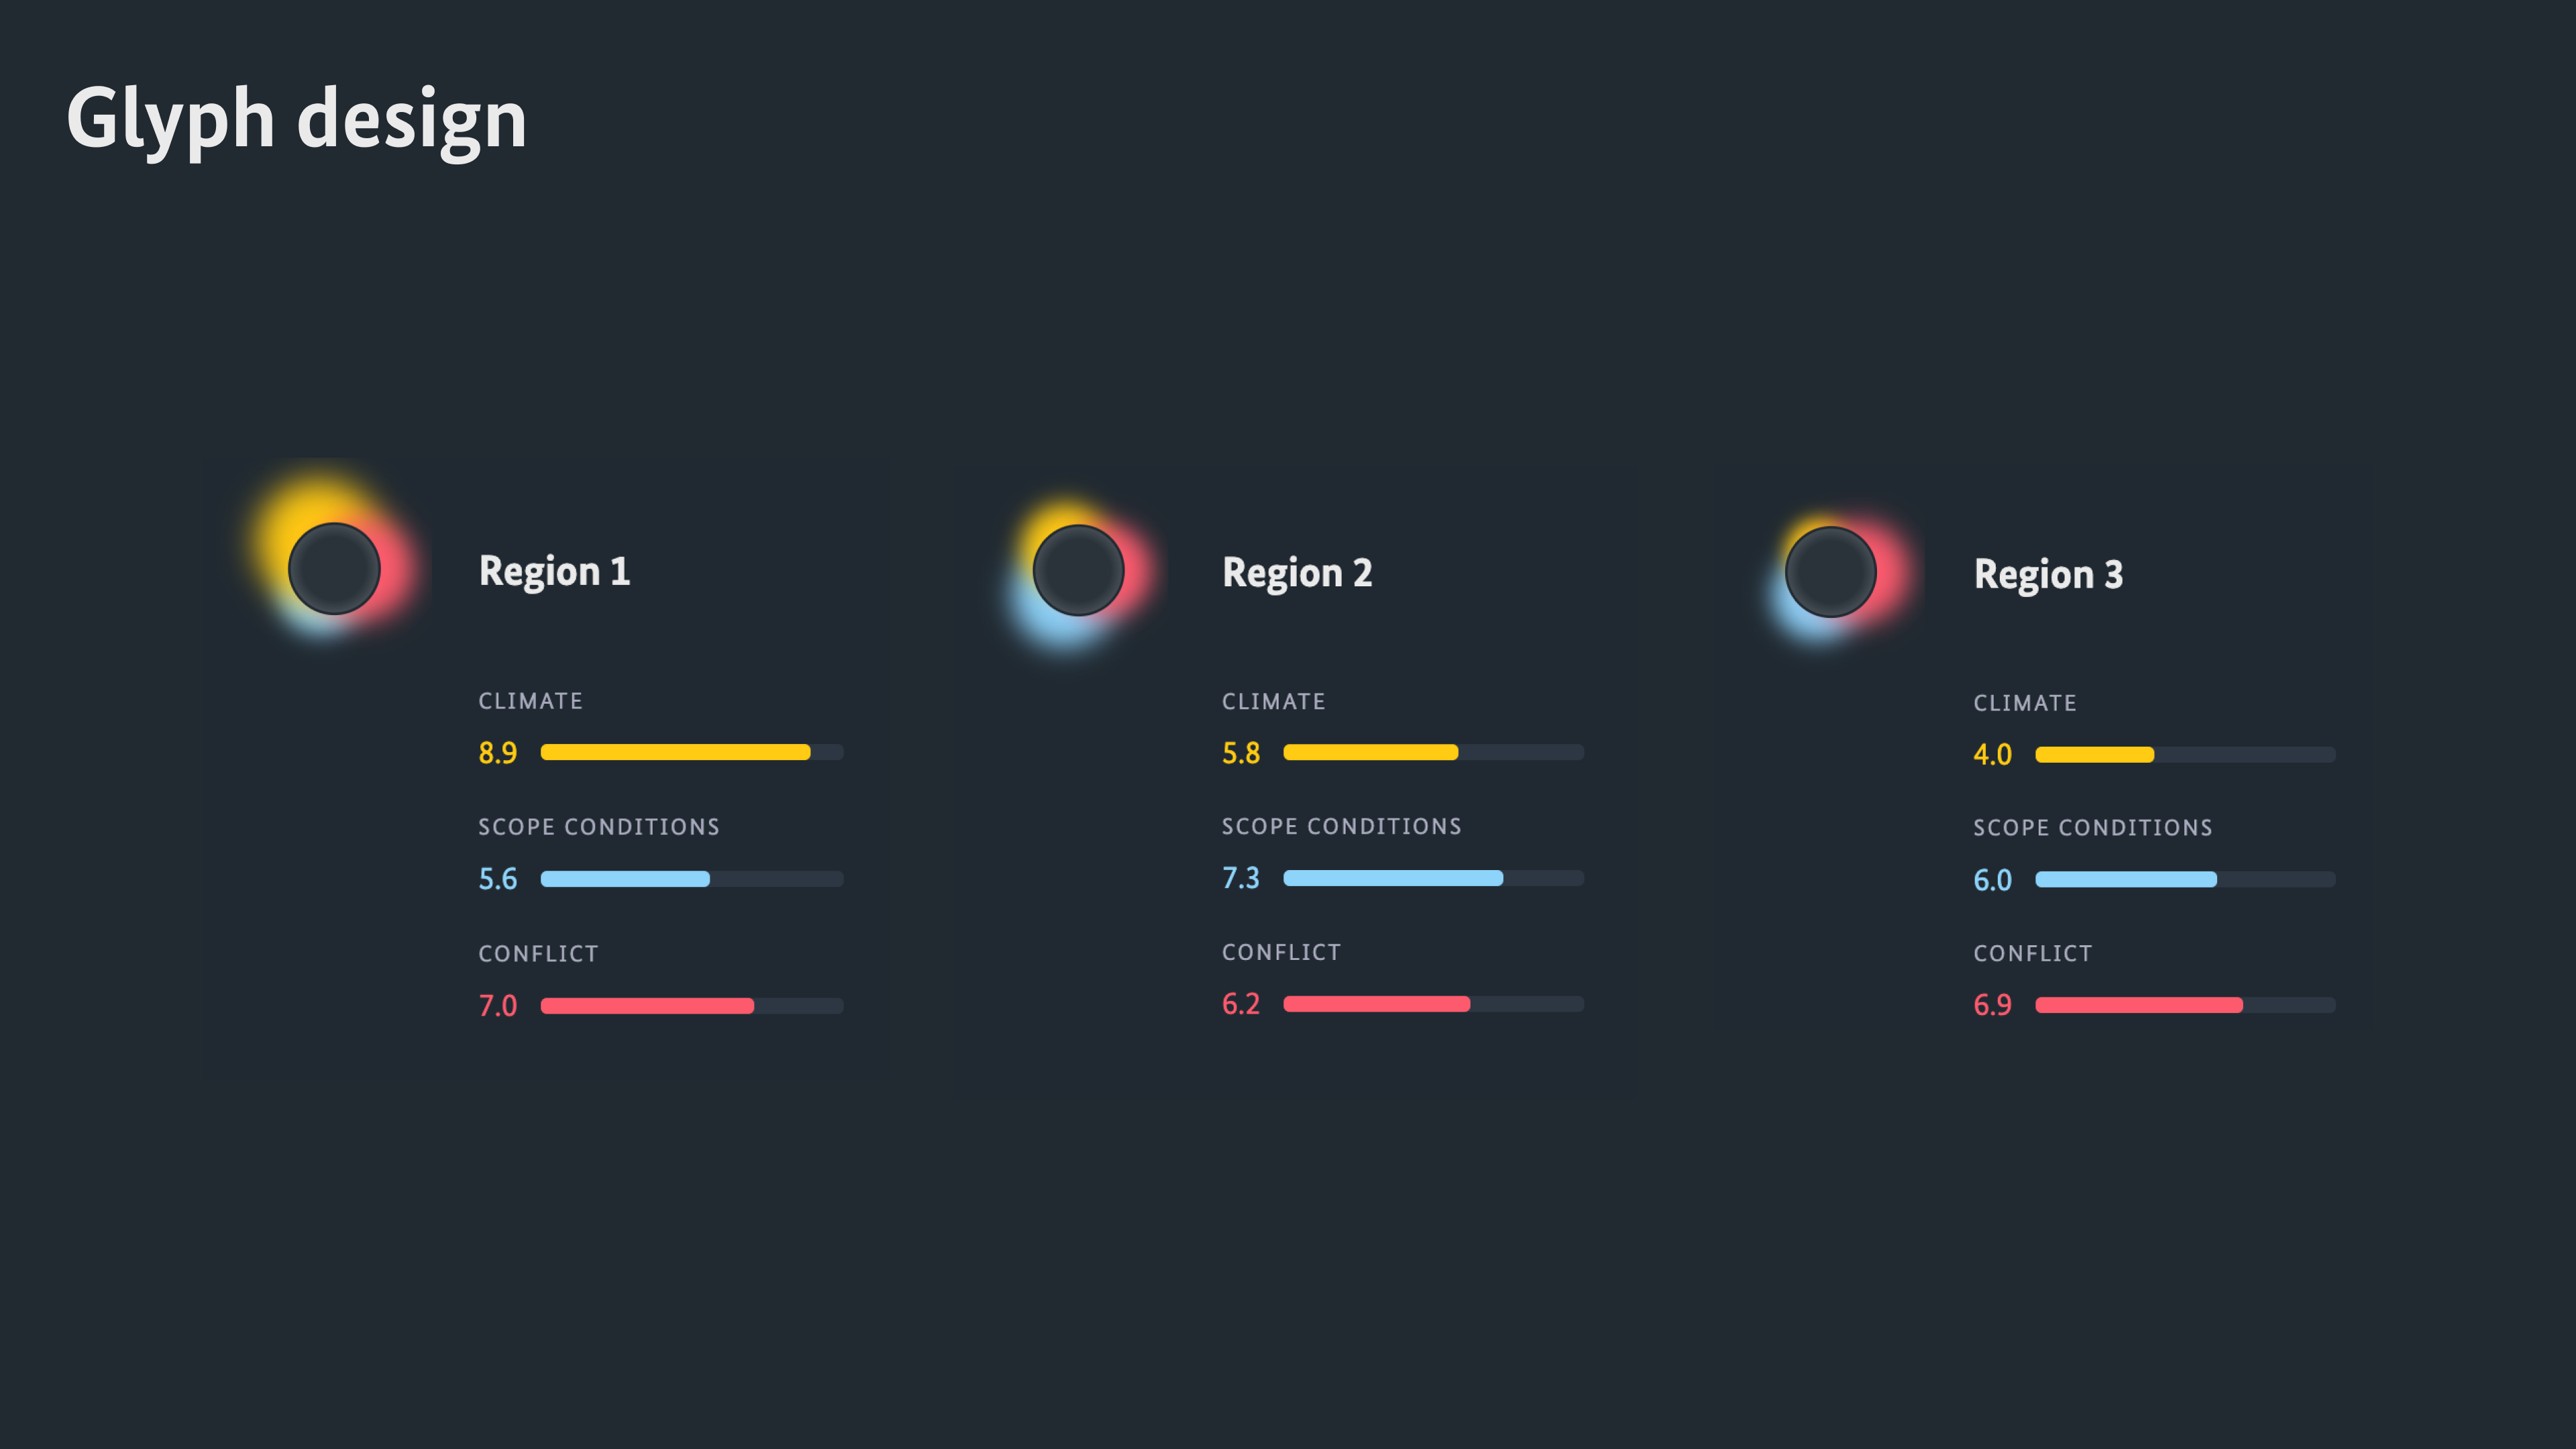
At the same time, we are considering more fundamentally how the PREVIEW team and the German Foreign Office can communicate data more effectively. To this end, we are developing a Data Design Language, which provides an expressive repertoire of design elements, guidelines and components for effective data communication.
All fundamental design decisions are stored as design tokens, defining a single source of truth, and allowing consistent reuse across projects, applications, and media channels.


Rollout and Impact
The Data Design Language is documented in the form of a living styleguide, and currently implemented for internal products.
By supplying a toolkit and design repertoire, rather than just one-off projects, we enable the PREVIEW team to take real ownership and put design to use in the organization. Our design-token-centric approach makes it easy to adapt to the needs of different stakeholders and supply themes and templates for a variety of tools and platforms.
Contact us, in case you want to learn more about this approach and its benefits.