Truth & Beauty for Science!
I taught a training course for data visualization for scientists in Utrecht, Netherlands, August 2018. For more information, check out this interview I did with the organizers from Graphic Hunters.
Visual depictions are a tremendously important, but often neglected tool in scientific practice and communication. In this training, Moritz Stefaner, a leading expert in the field of data visualization, will provide practical tips and guidance in how to use data visualization most effectively in your scientific practice.
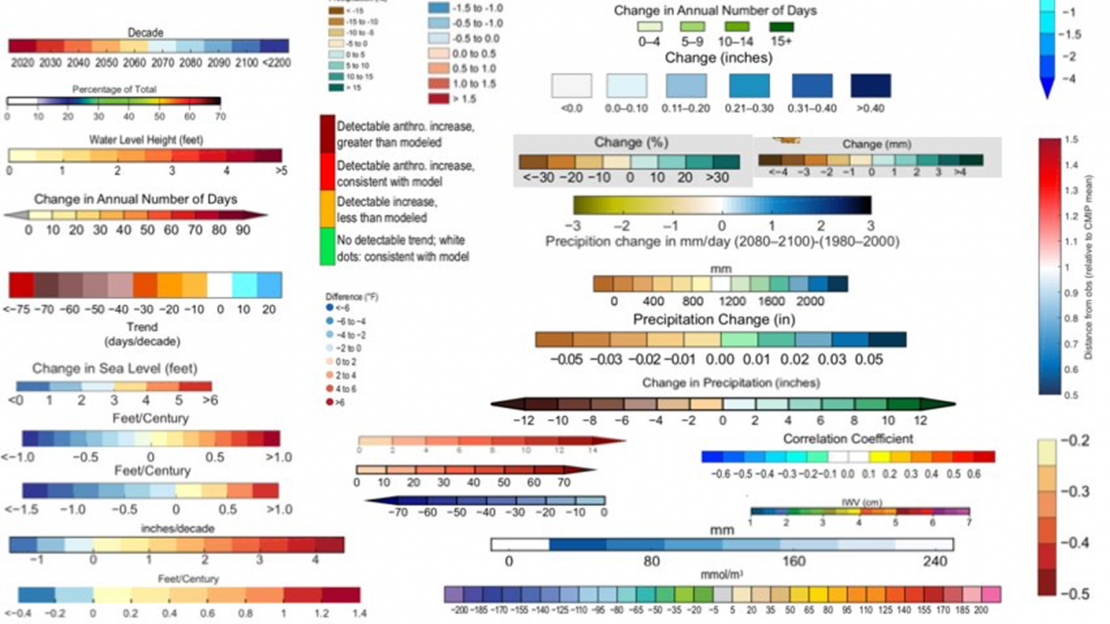
You will learn about the pros and cons of different diagram types, the best use of visual variables, tips for working with colors, layout tricks and the role of storytelling and narrative techniques. All linked to your profession in the scientific world.
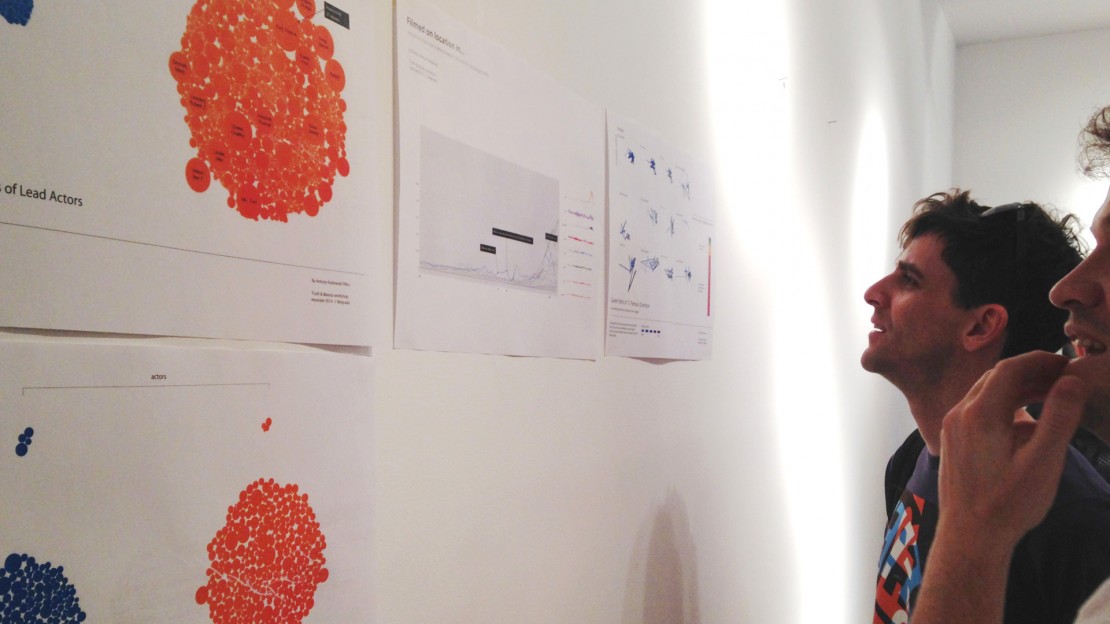
In this training we will work with datasets that are related to scientific topics. In several assignments you will learn to come up with effective visual solutions.


