Whenever I have the opportunity, I enjoy to share my experiences and teach people some mad data visualization skills.

Whenever I have the opportunity, I enjoy to share my experiences and teach people some mad data visualization skills.

Beyond heatmaps — Data visualization for a warming planet
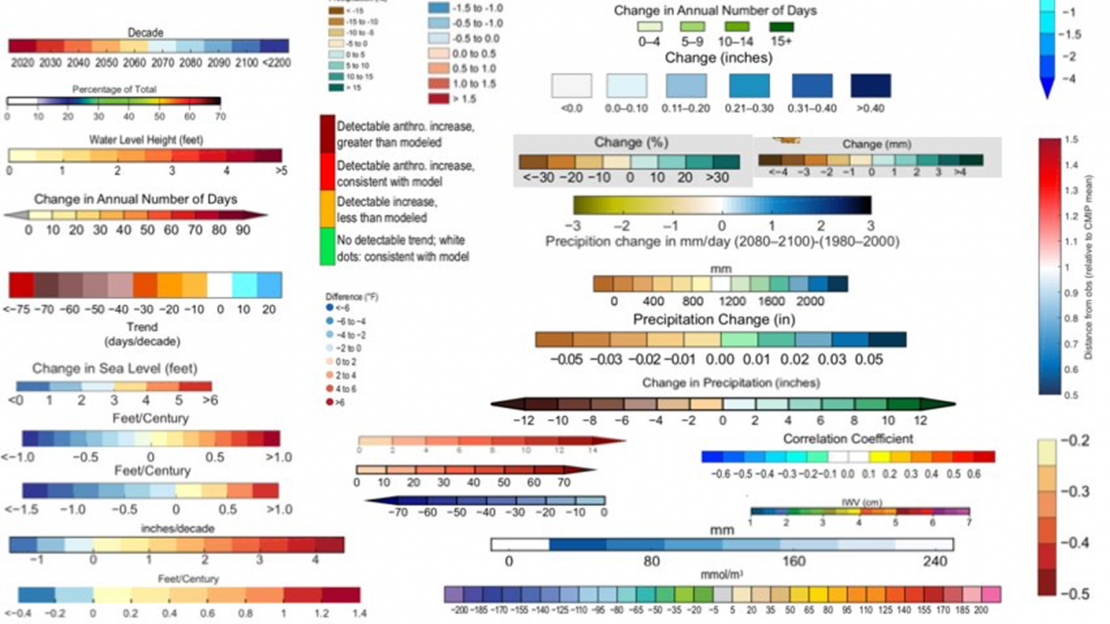
As it seems, we have hit a wall in the visual rhetorics surrounding climate change. How can data visualization help to make global warming more graspable? We investigated this question in the course "Beyond heatmaps" at HfK Bremen.
Truth & Beauty for Science!
I taught a training course for data visualization for scientists in Utrecht, Netherlands, August 2018. For more information, check out this interview I did with the organizers from Graphic Hunters.

Truth & Beauty at resonate
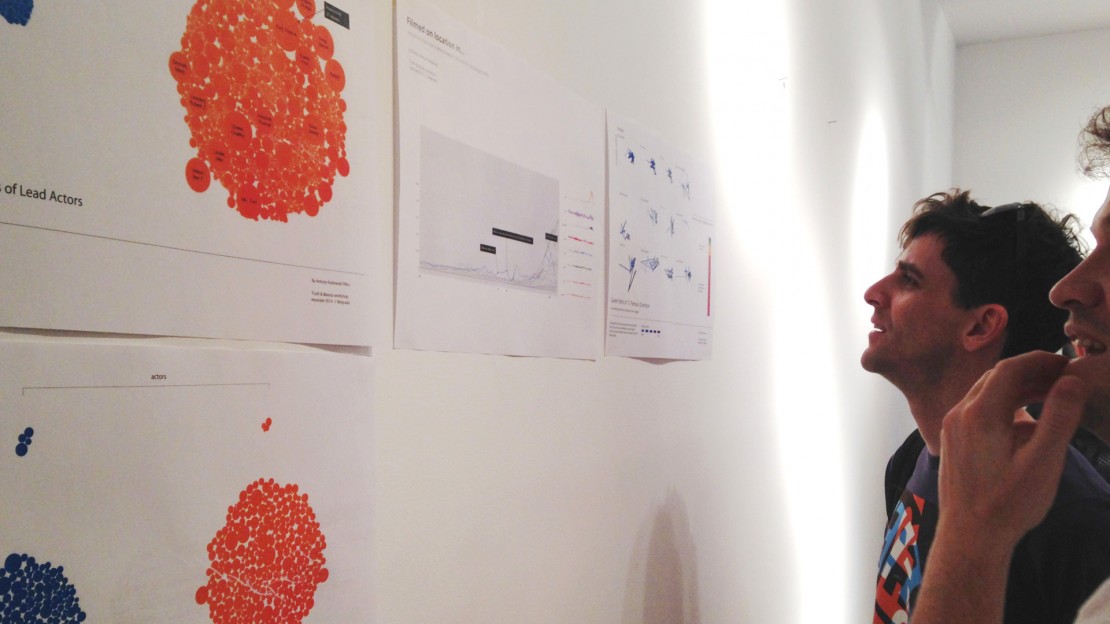
Together with Dominikus Baur, I taught a 3-day workshop on data visualization at resonate.

Weltbilder
As part of the master's program at Digital Media program in Bremen, I taught a full-semester course on Information visualization under the title of "Weltbilder" ("World Images").

Insect Smarts Workshop
I taught a workshop at eyeo festival on how complex patterns can emerge from networked interactions in ensembles of simple agents.
Workshops for scientists
I have taught one to two day workshops at various universities and research institutions, among others at HU Berlin, University of Osnabrück, and Bernstein Center Berlin.
Workshops for designers
I have taught one to two day workshops at various universities and research institutions, among others at resonate festival, HfK Bremen, Haute Ecole Albert Jacquard, Namur, and Hochschule für Gestaltung Schwäbisch Gmünd.