


Open Systems Wall Display
Visualizing network security situations in real time
How do you keep track of security situations on thousands of servers world-wide? The leading enterprise ICT security provider Open Systems commissioned me to produce an ambient, large scale, real-time visualization of security incidents, server statuses and support activities for their offices.
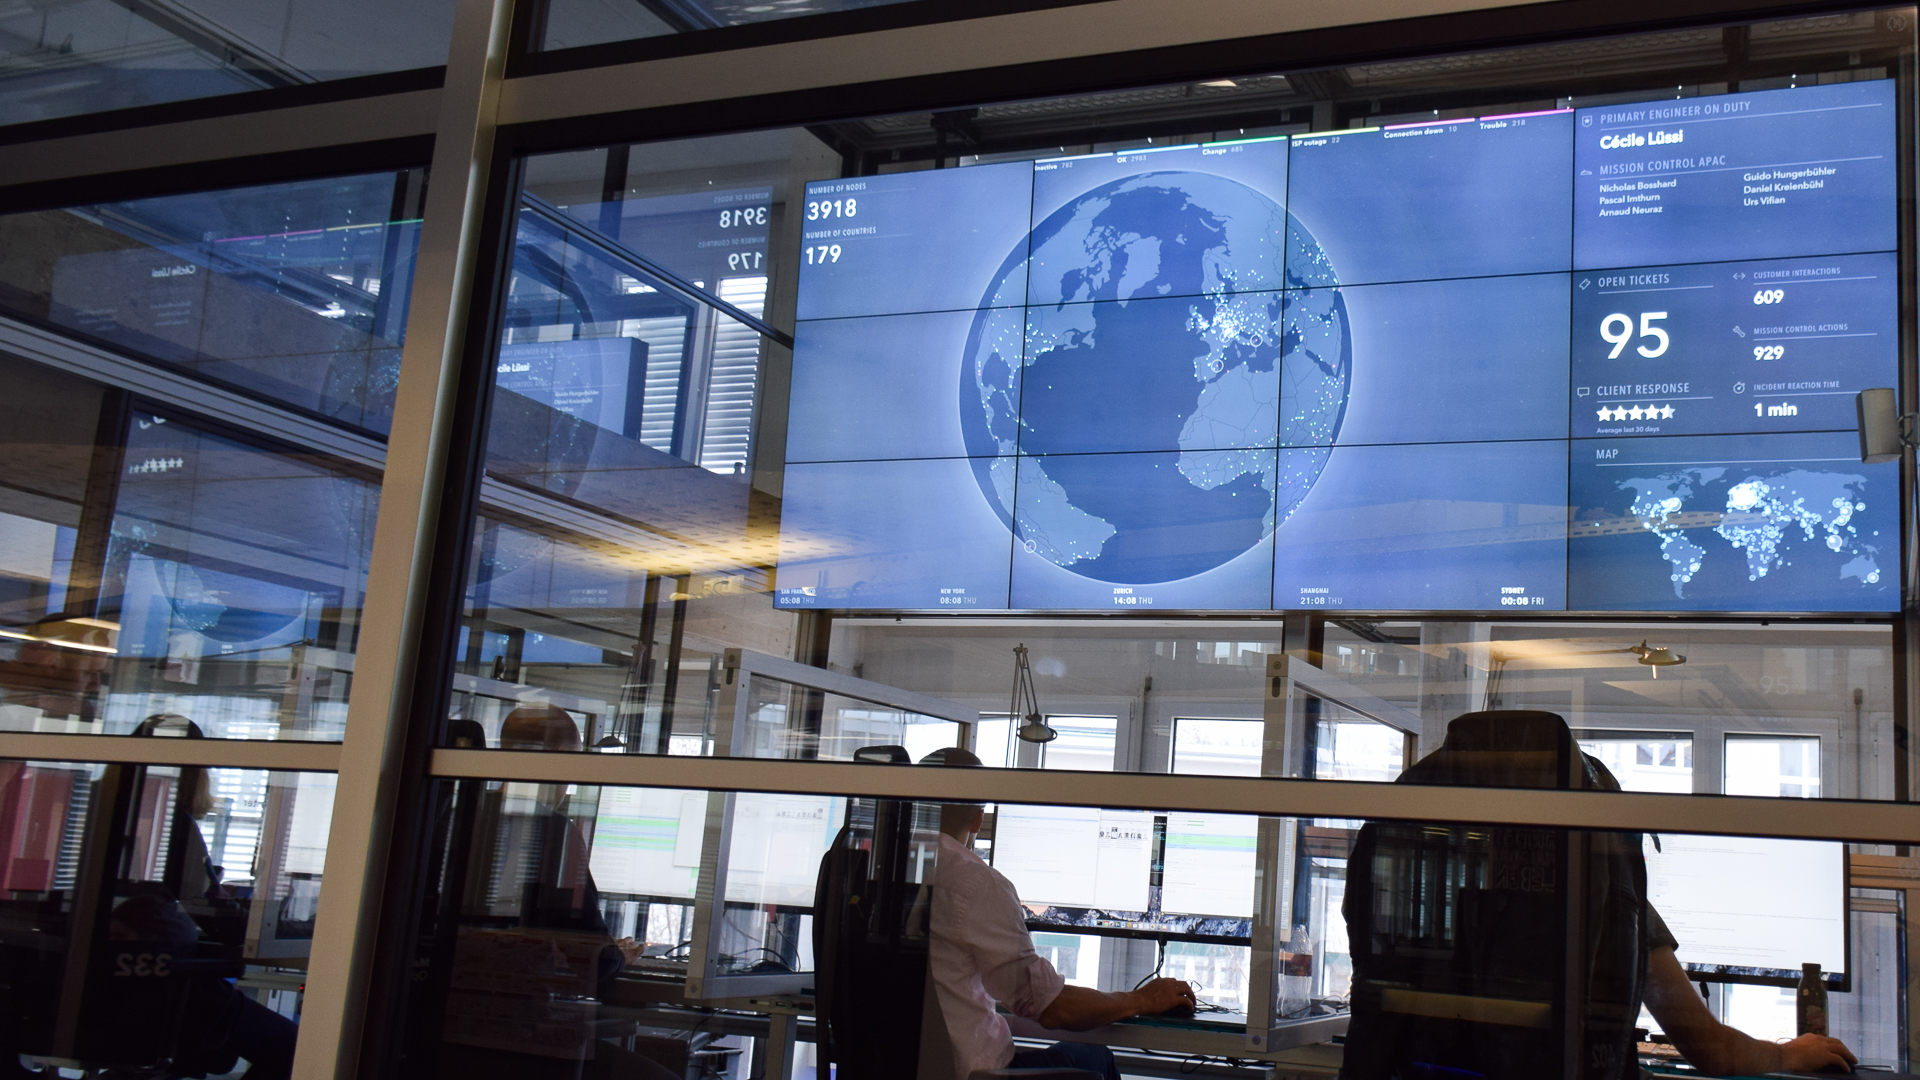
The display in situ
Responsiveness is critical for internet security services. The Open Systems Wall Display provides the Mission Control team with a constant overview and ambient awareness of the vast network of services they run for their clients. Security events, change of server status and configuration rollouts are visualized in real-time on large displays consisting of 12 full HD panels each.
Video
Structure
The application comprises three main views:
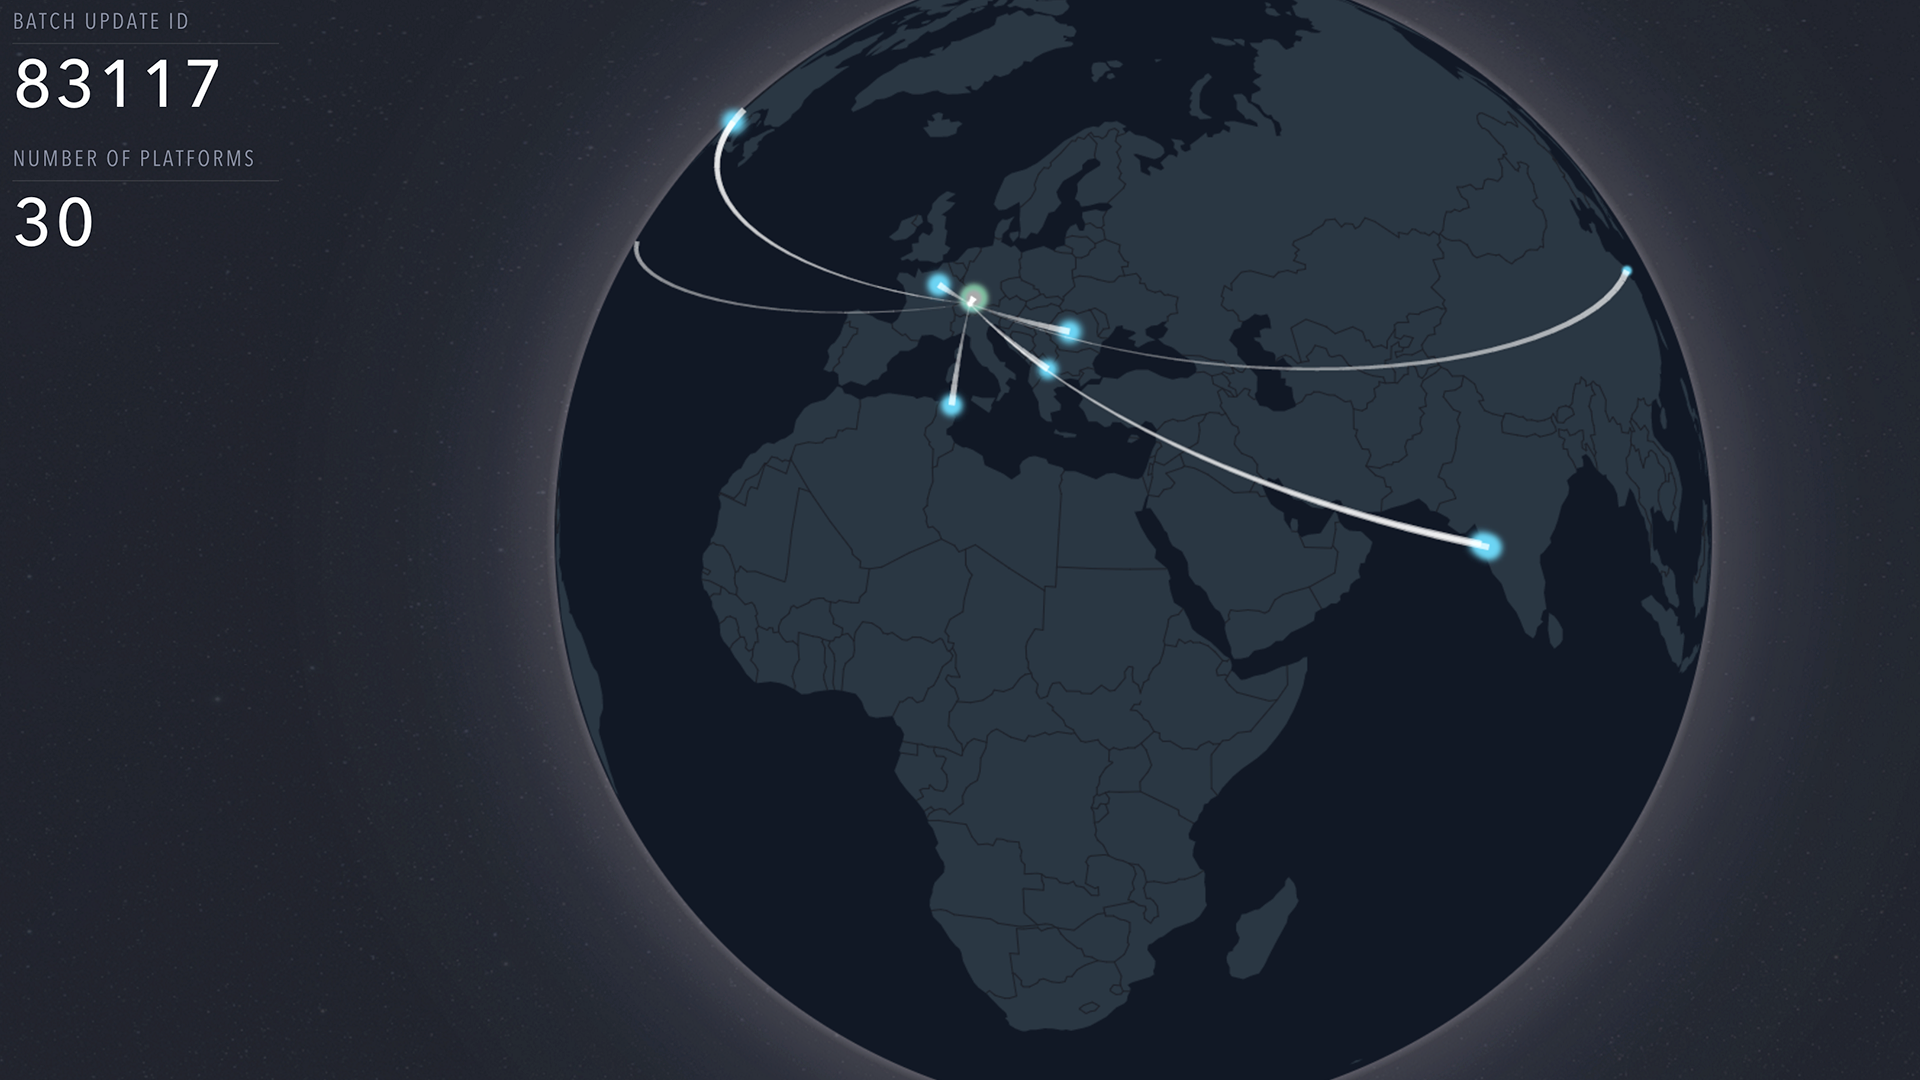
- Globe: provides the big picture of server statuses around the world and highlights emergency situations
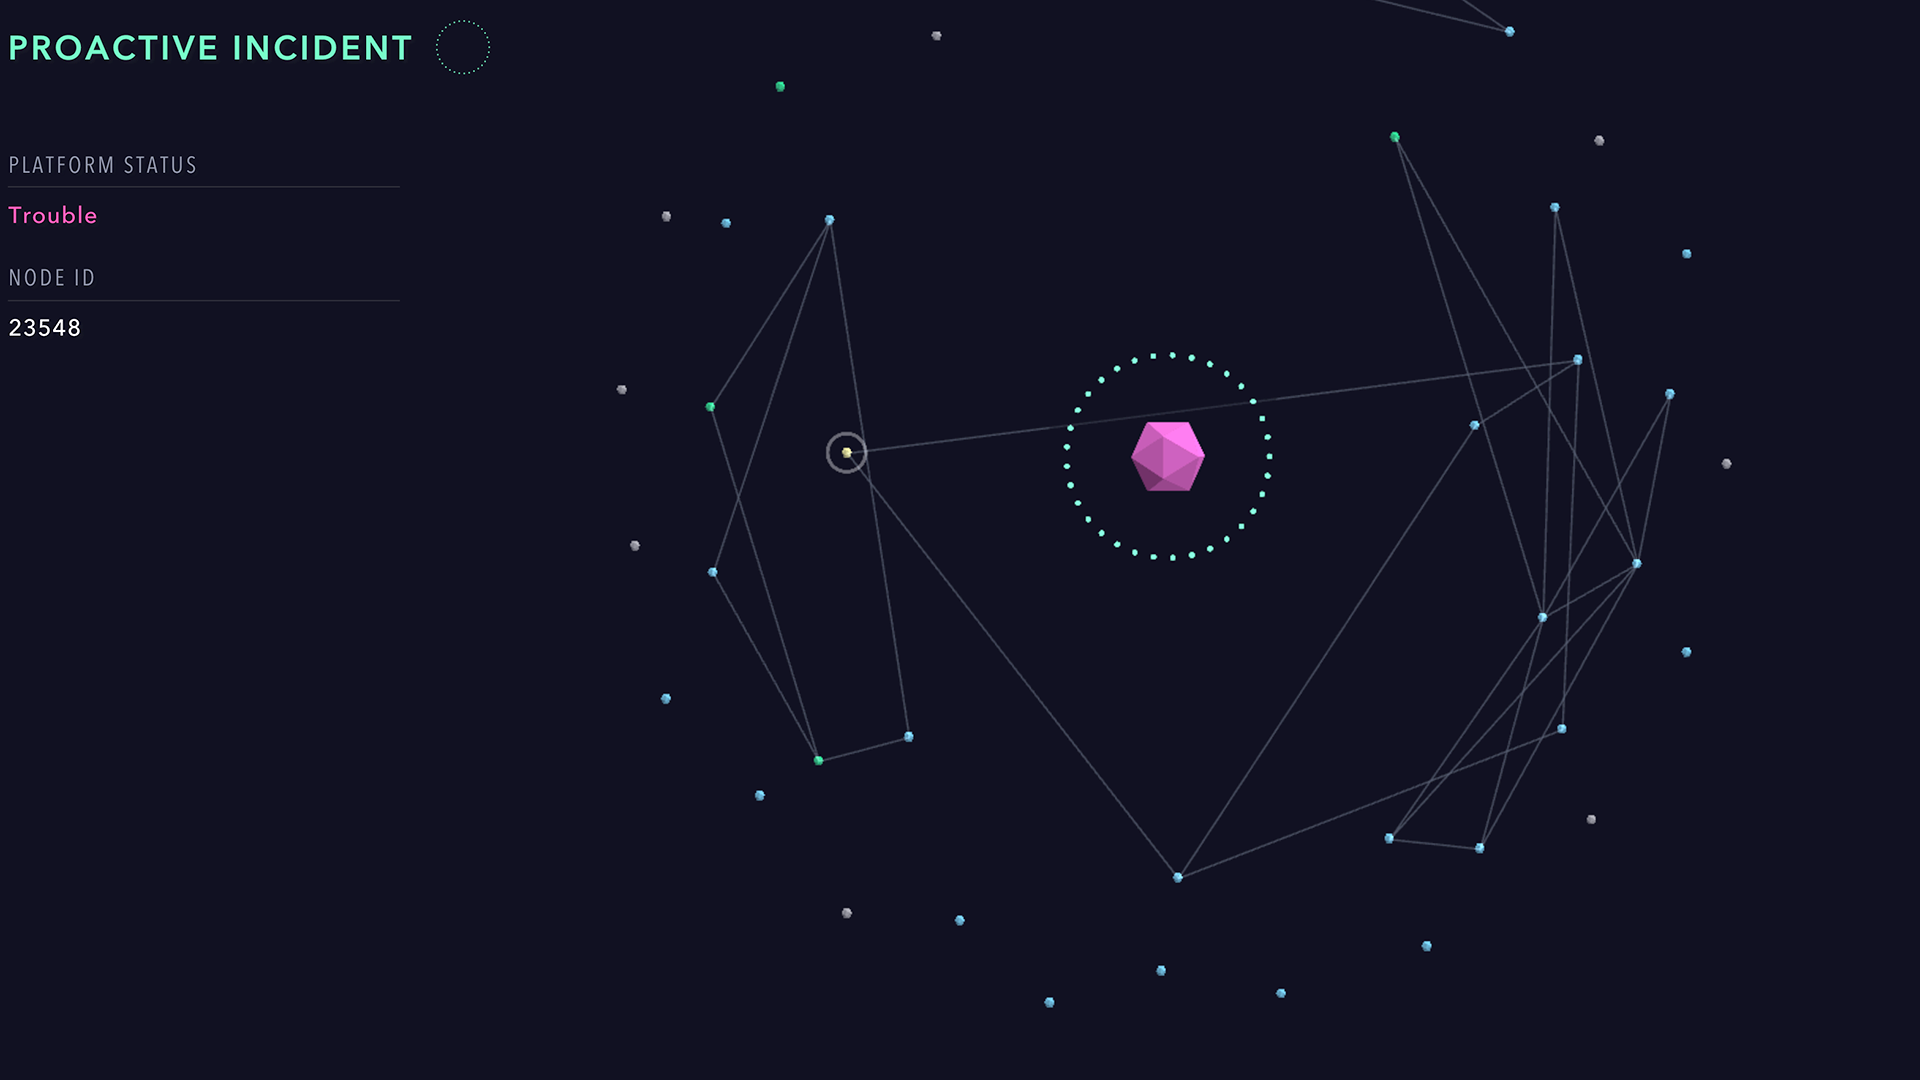
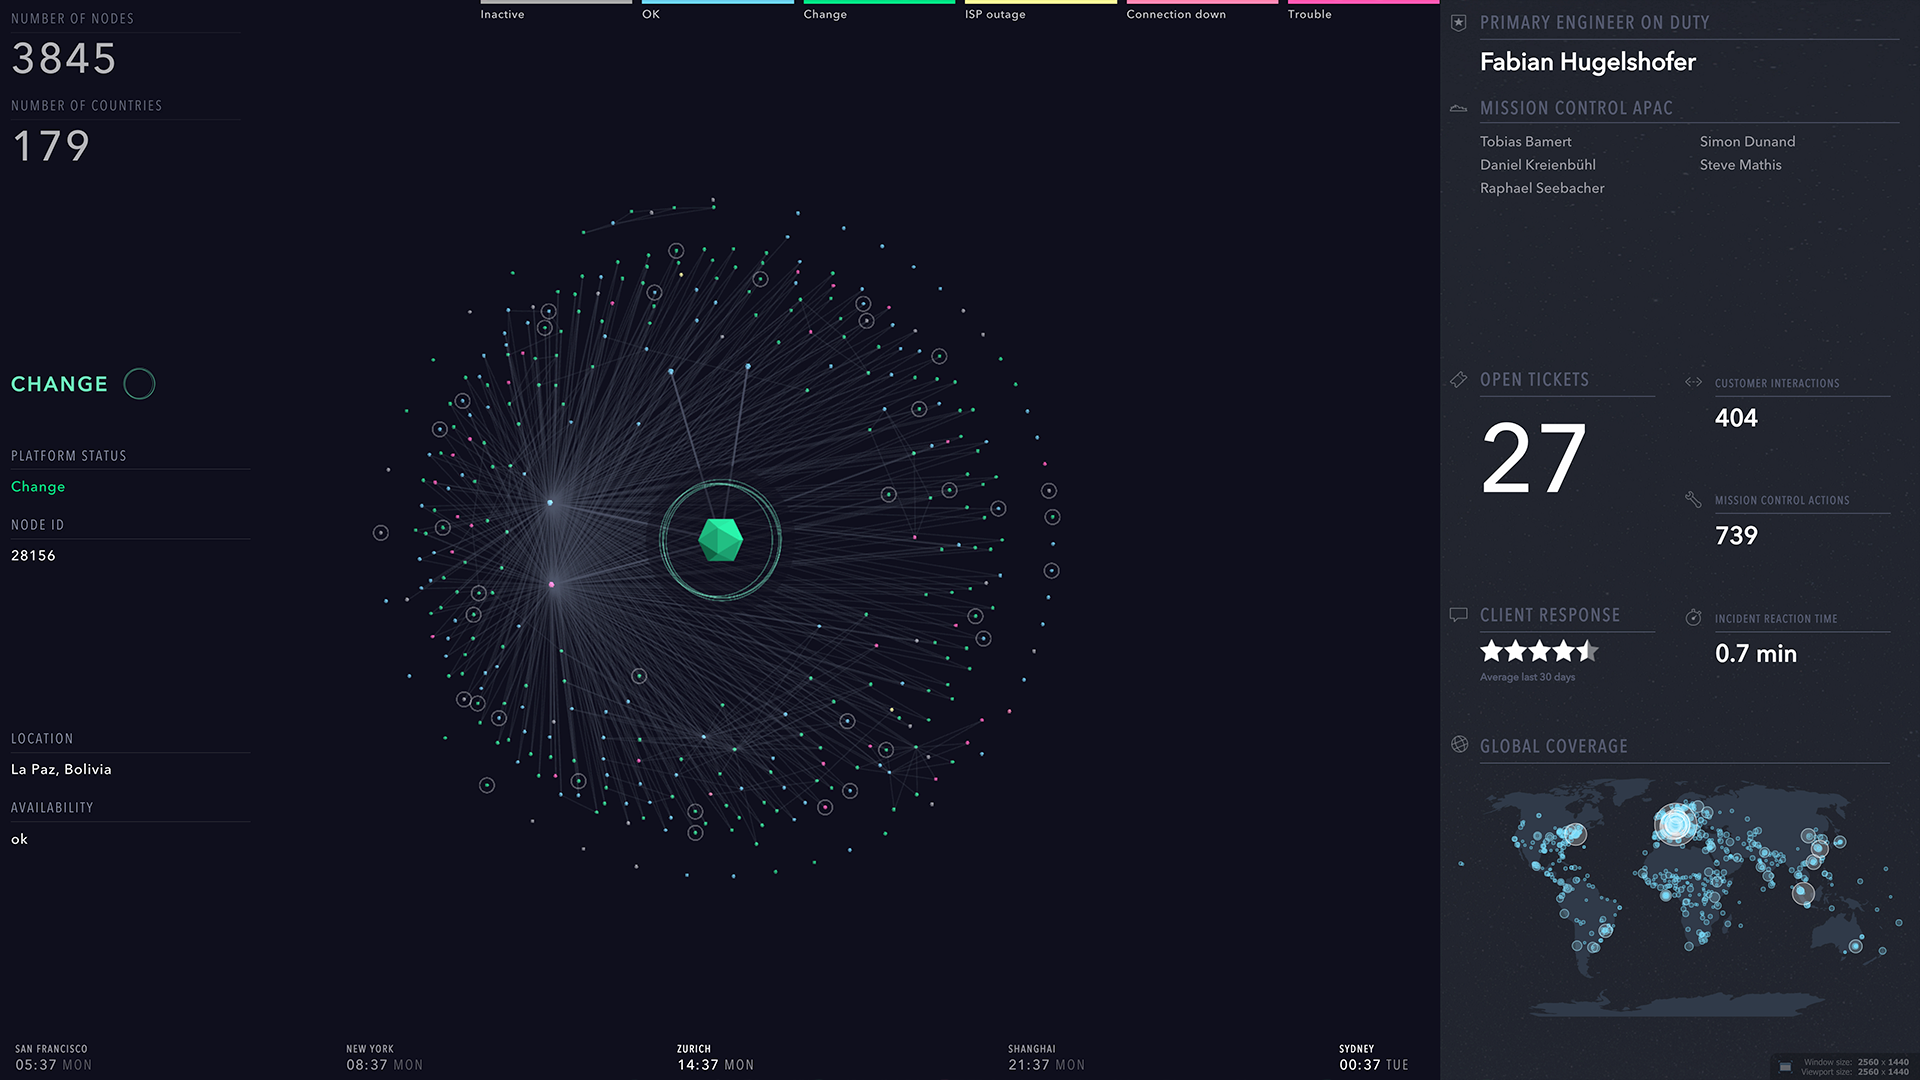
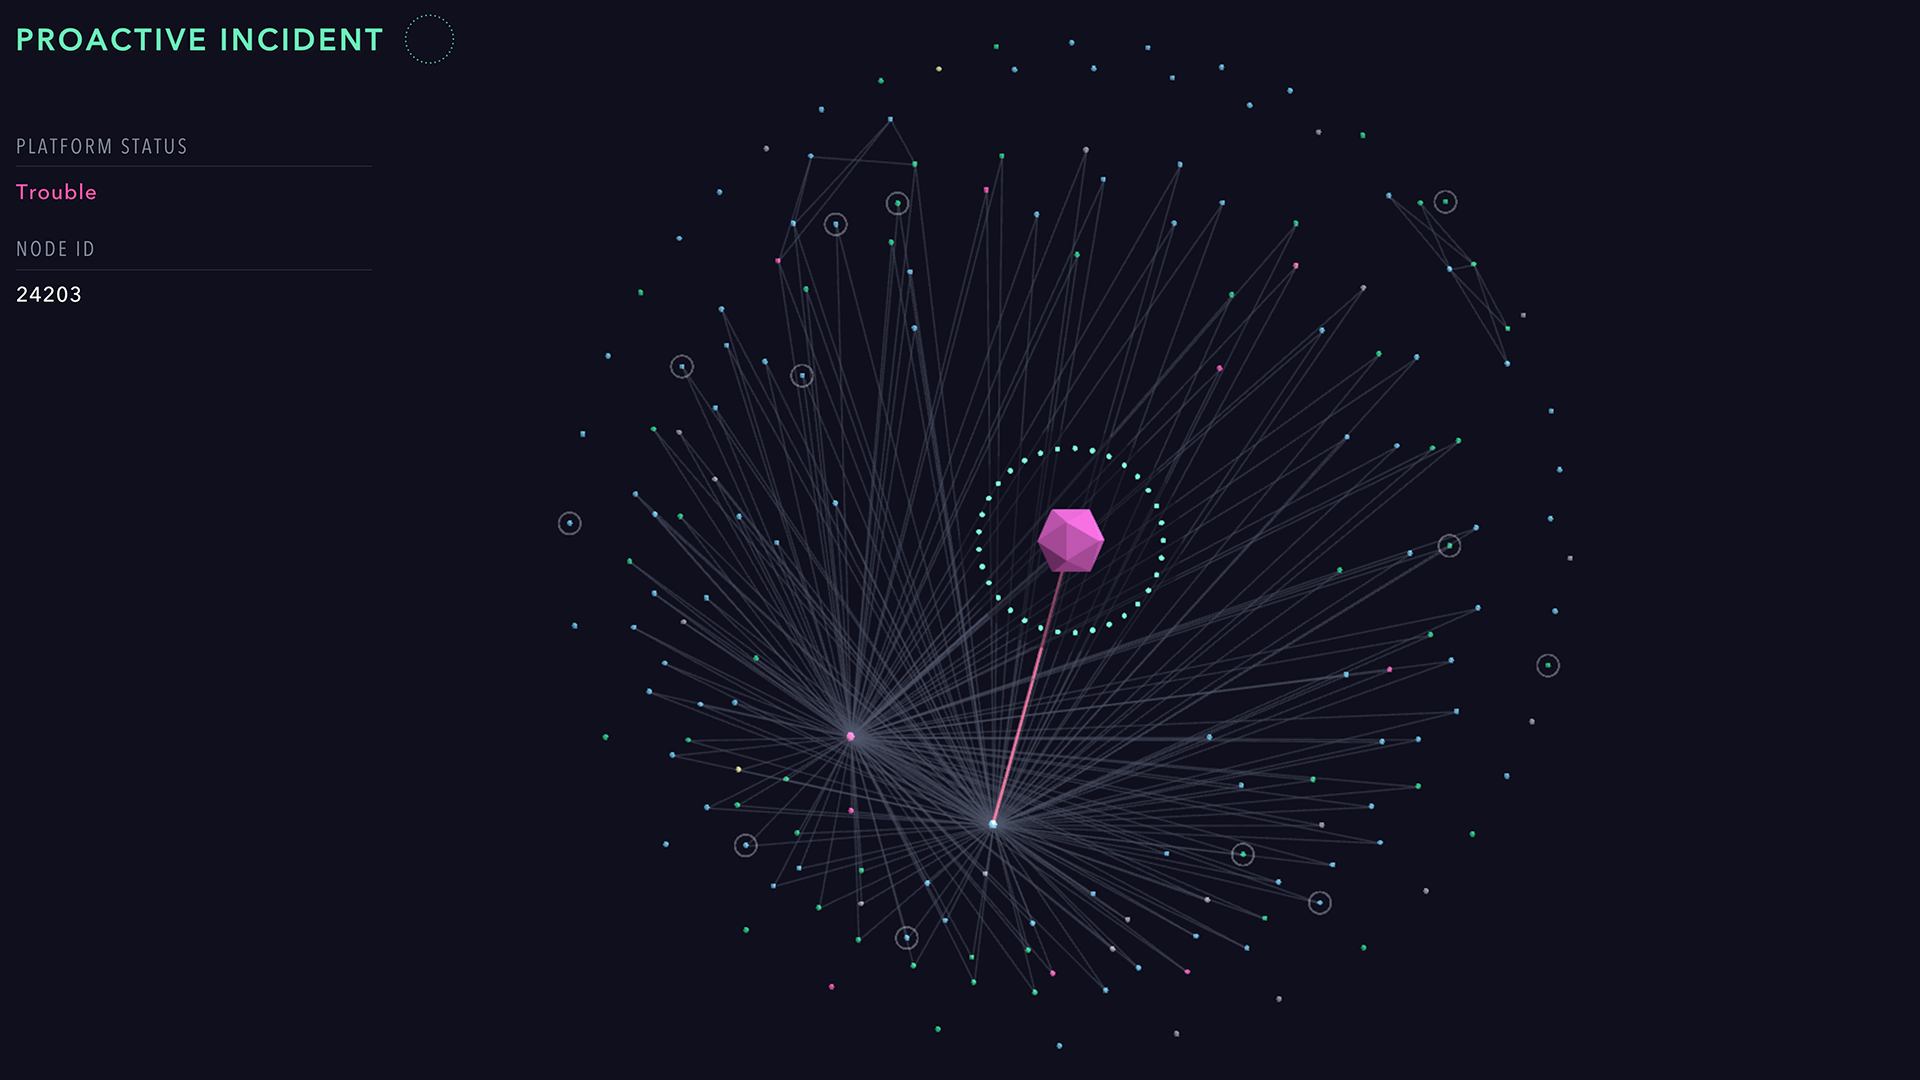
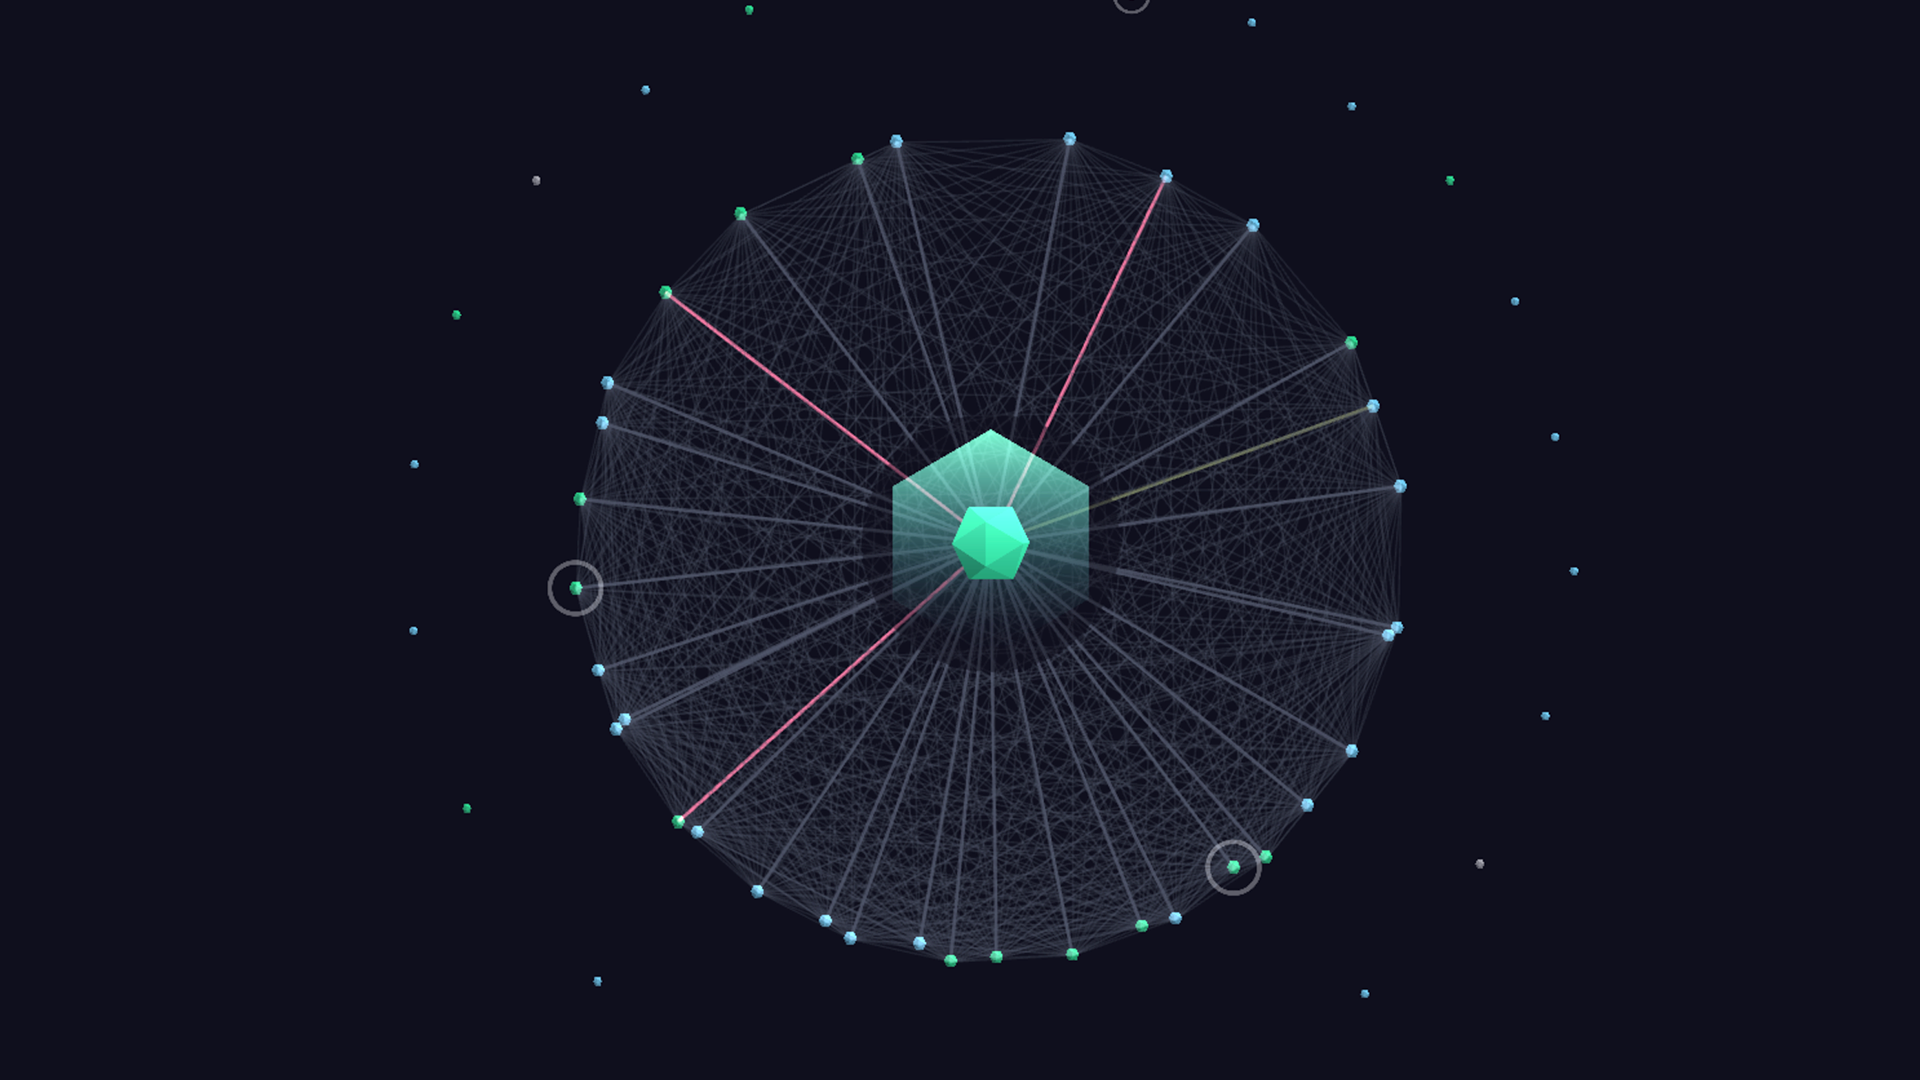
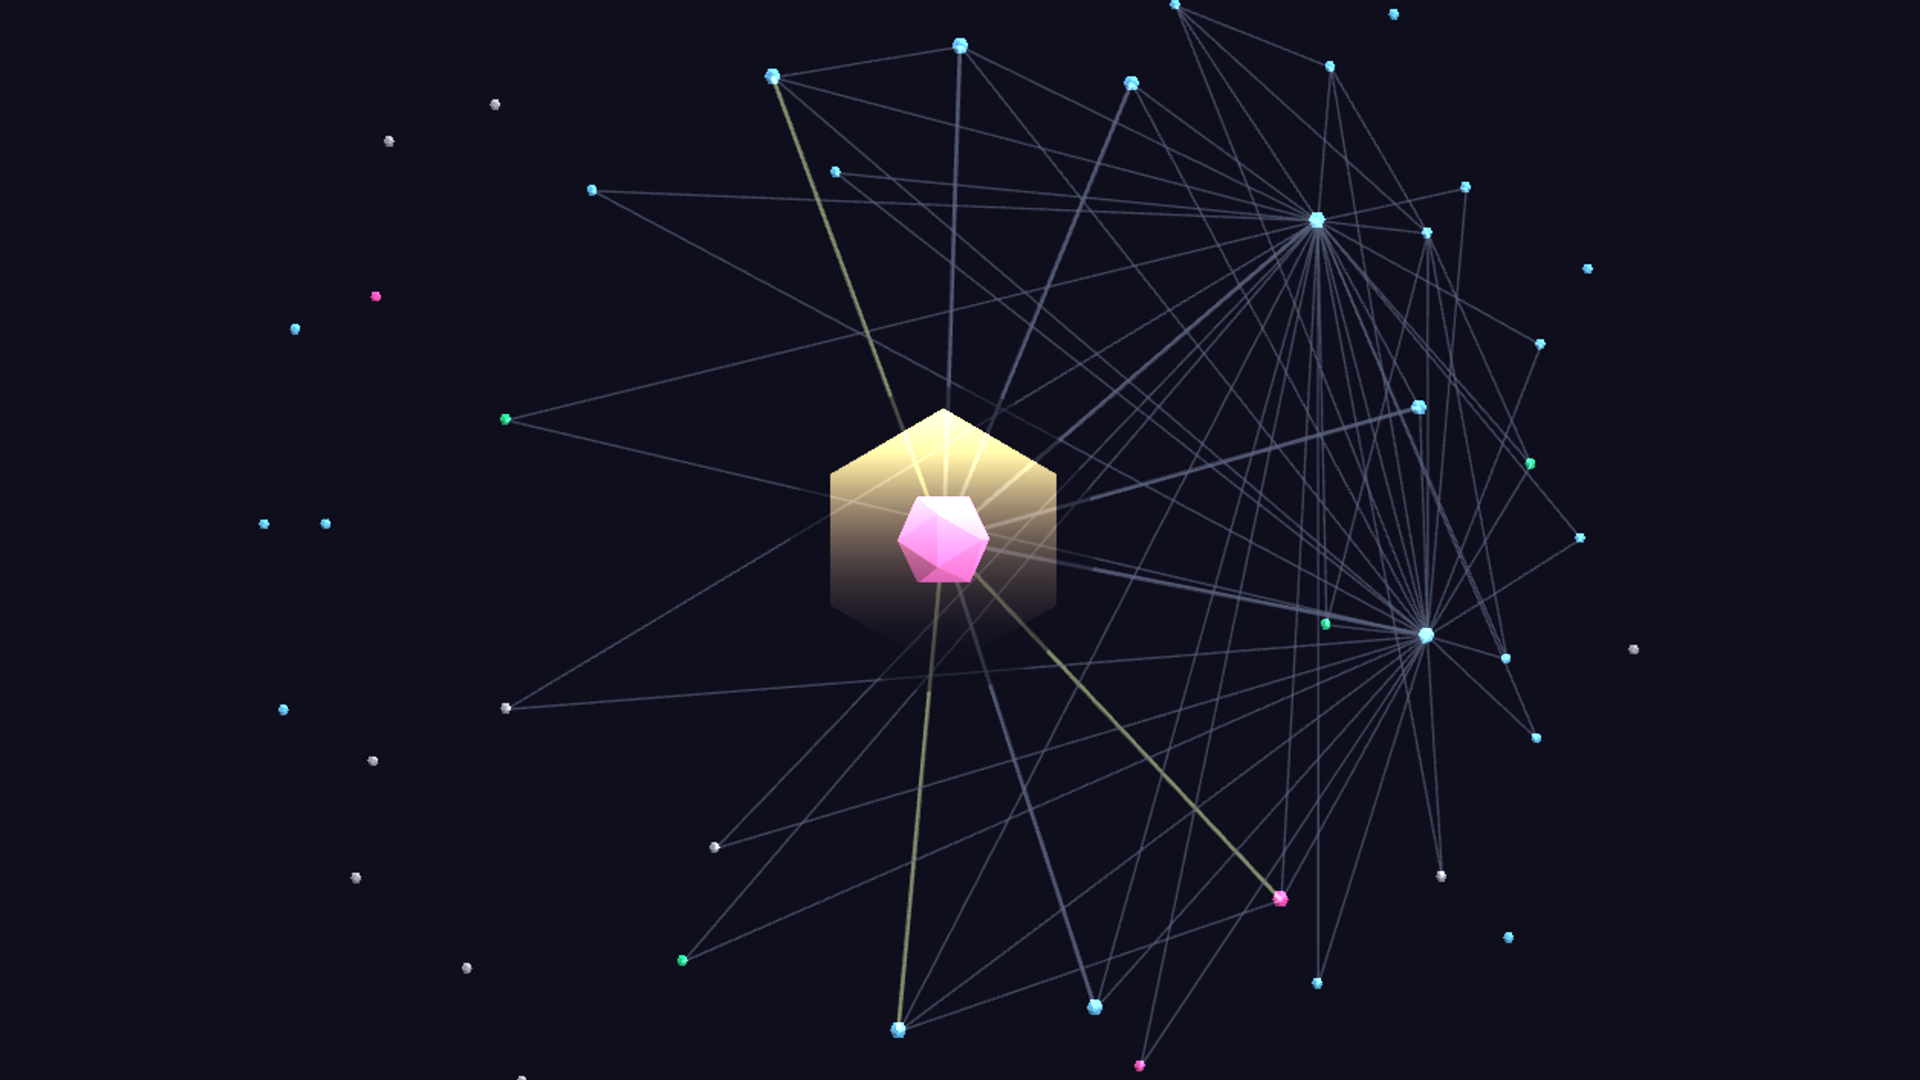
- Zoom: highlights the situation around a client single service node, and shows its network environment
- Rollout: displays code and cofiguration patches, as they are deployed by the Mission Control engineer
In addition, the sidebar always shows information on the current team activity: who's on staff, number of open tickets, reaction times, …
In the animation sequencing, special emphasis was put on finding a good automatic selection of view successions and "trip planning" around the world. The priority queue takes urgency, novelty, type, travel distance and other parameters into account, in order to select the next — most relevant — focus. Each sequence has slightly variable parameters (such as durations, zoom levels, …) to keep the animations interesting also after repeated watching.

The three view types: Globe, Zoom, Rollout
Visual language
Mood designs for formulating the visual language
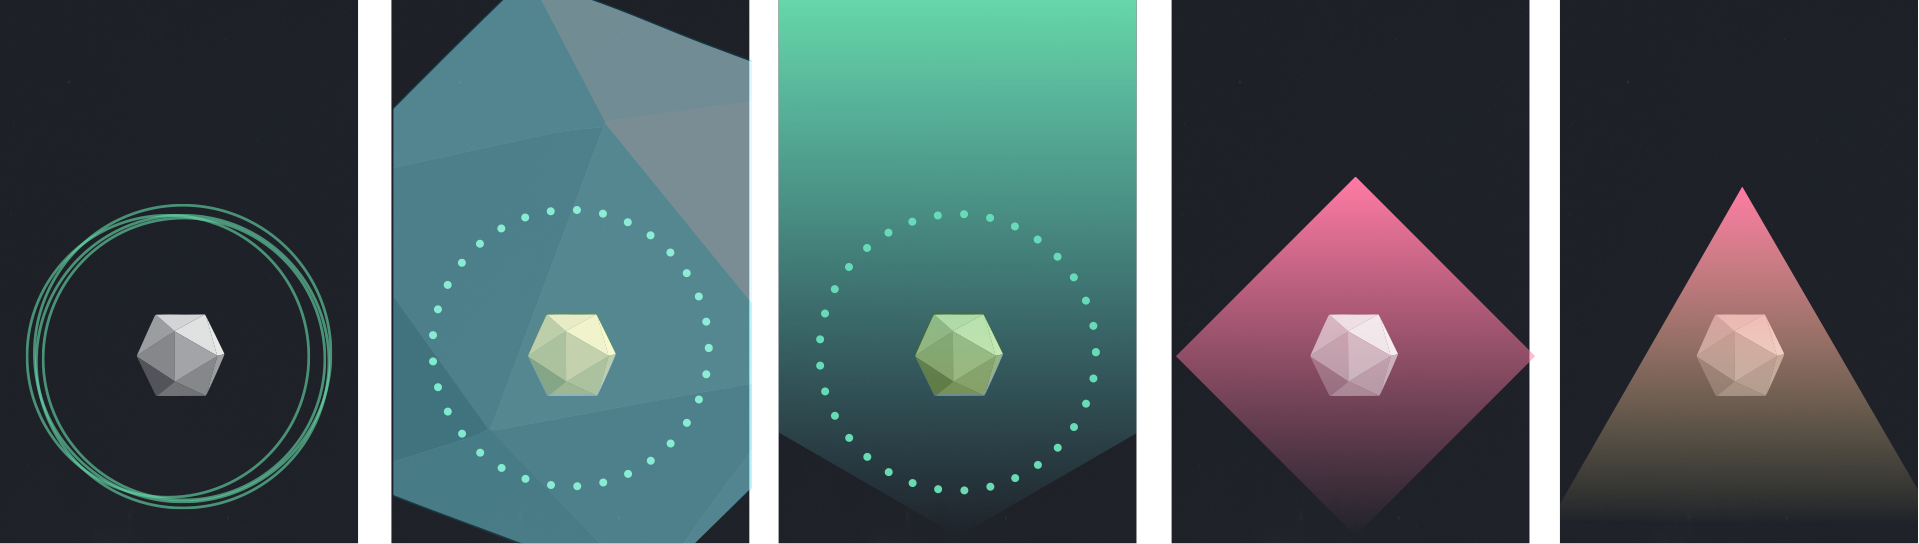
At the heart of the visual design is a visual language which encodes server statuses in color (in an escalating color scale from cool to hot) and activities (such as patches, fixes, alerts) as external shell or particle elements around the server symbol. These two language elements can be used in isolation or combined, in a variety of sizes and situations.
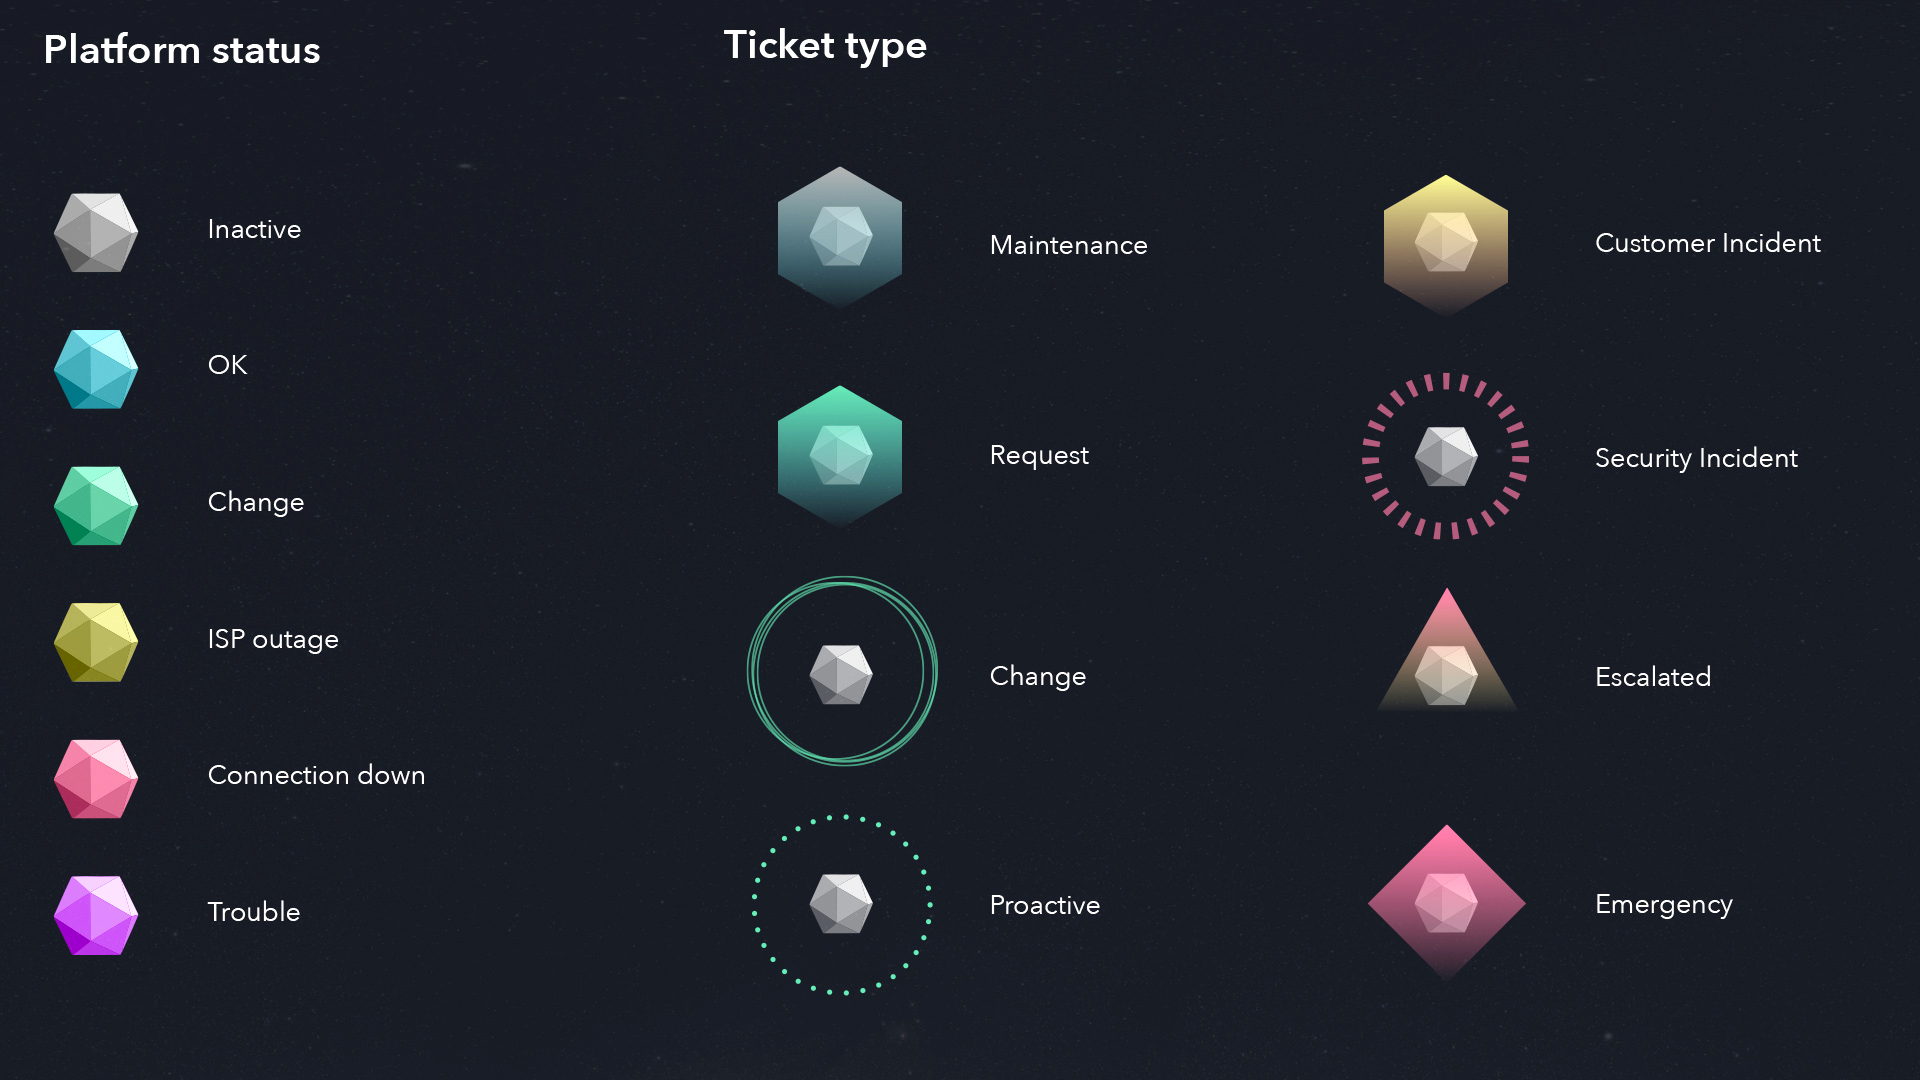
The visual vocabulary
Implementation
The application runs 24/7 at 30fps in 4k, in a fullscreen Chrome browser. We used ES2015, react, d3, and pixi.js. GreenSock TimelineMax was a great help for sequencing the animations. It was developed in collaboration with the Open Systems team. Thanks all!