Excellence Networks

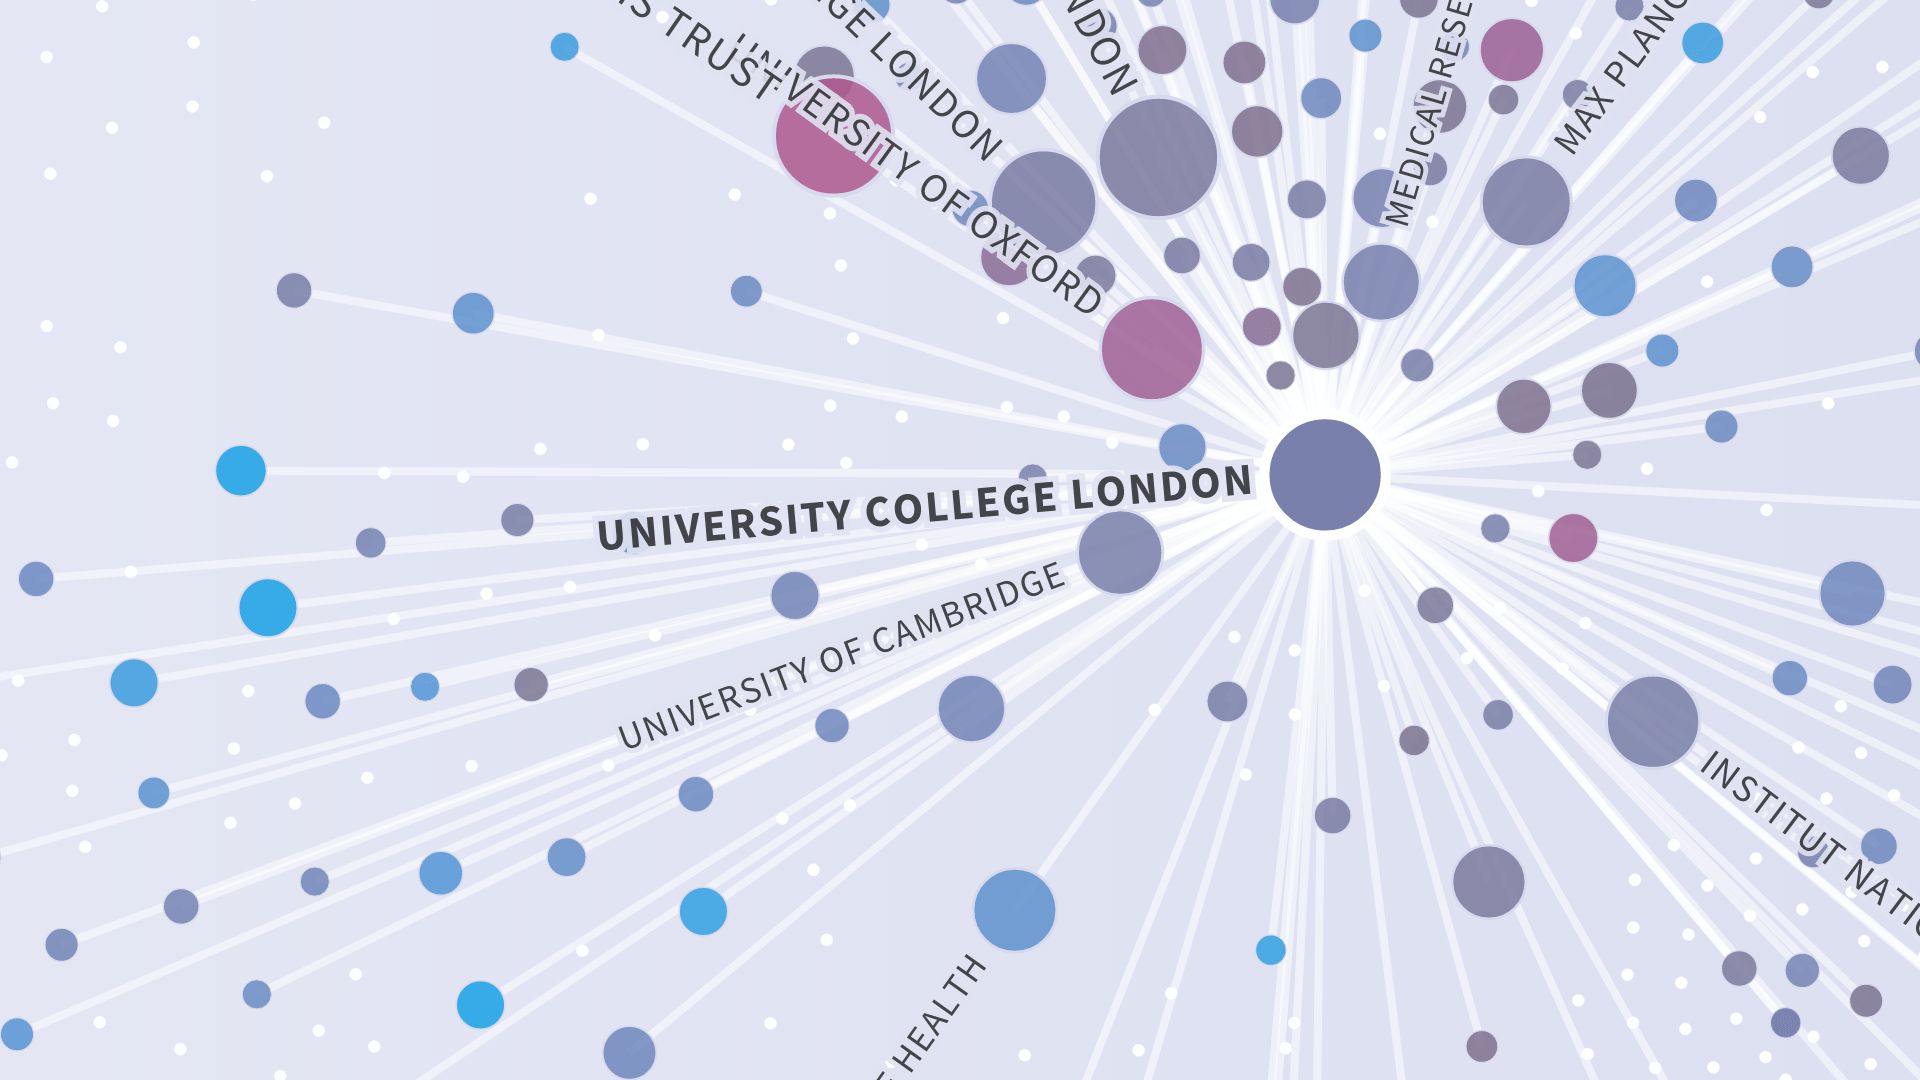
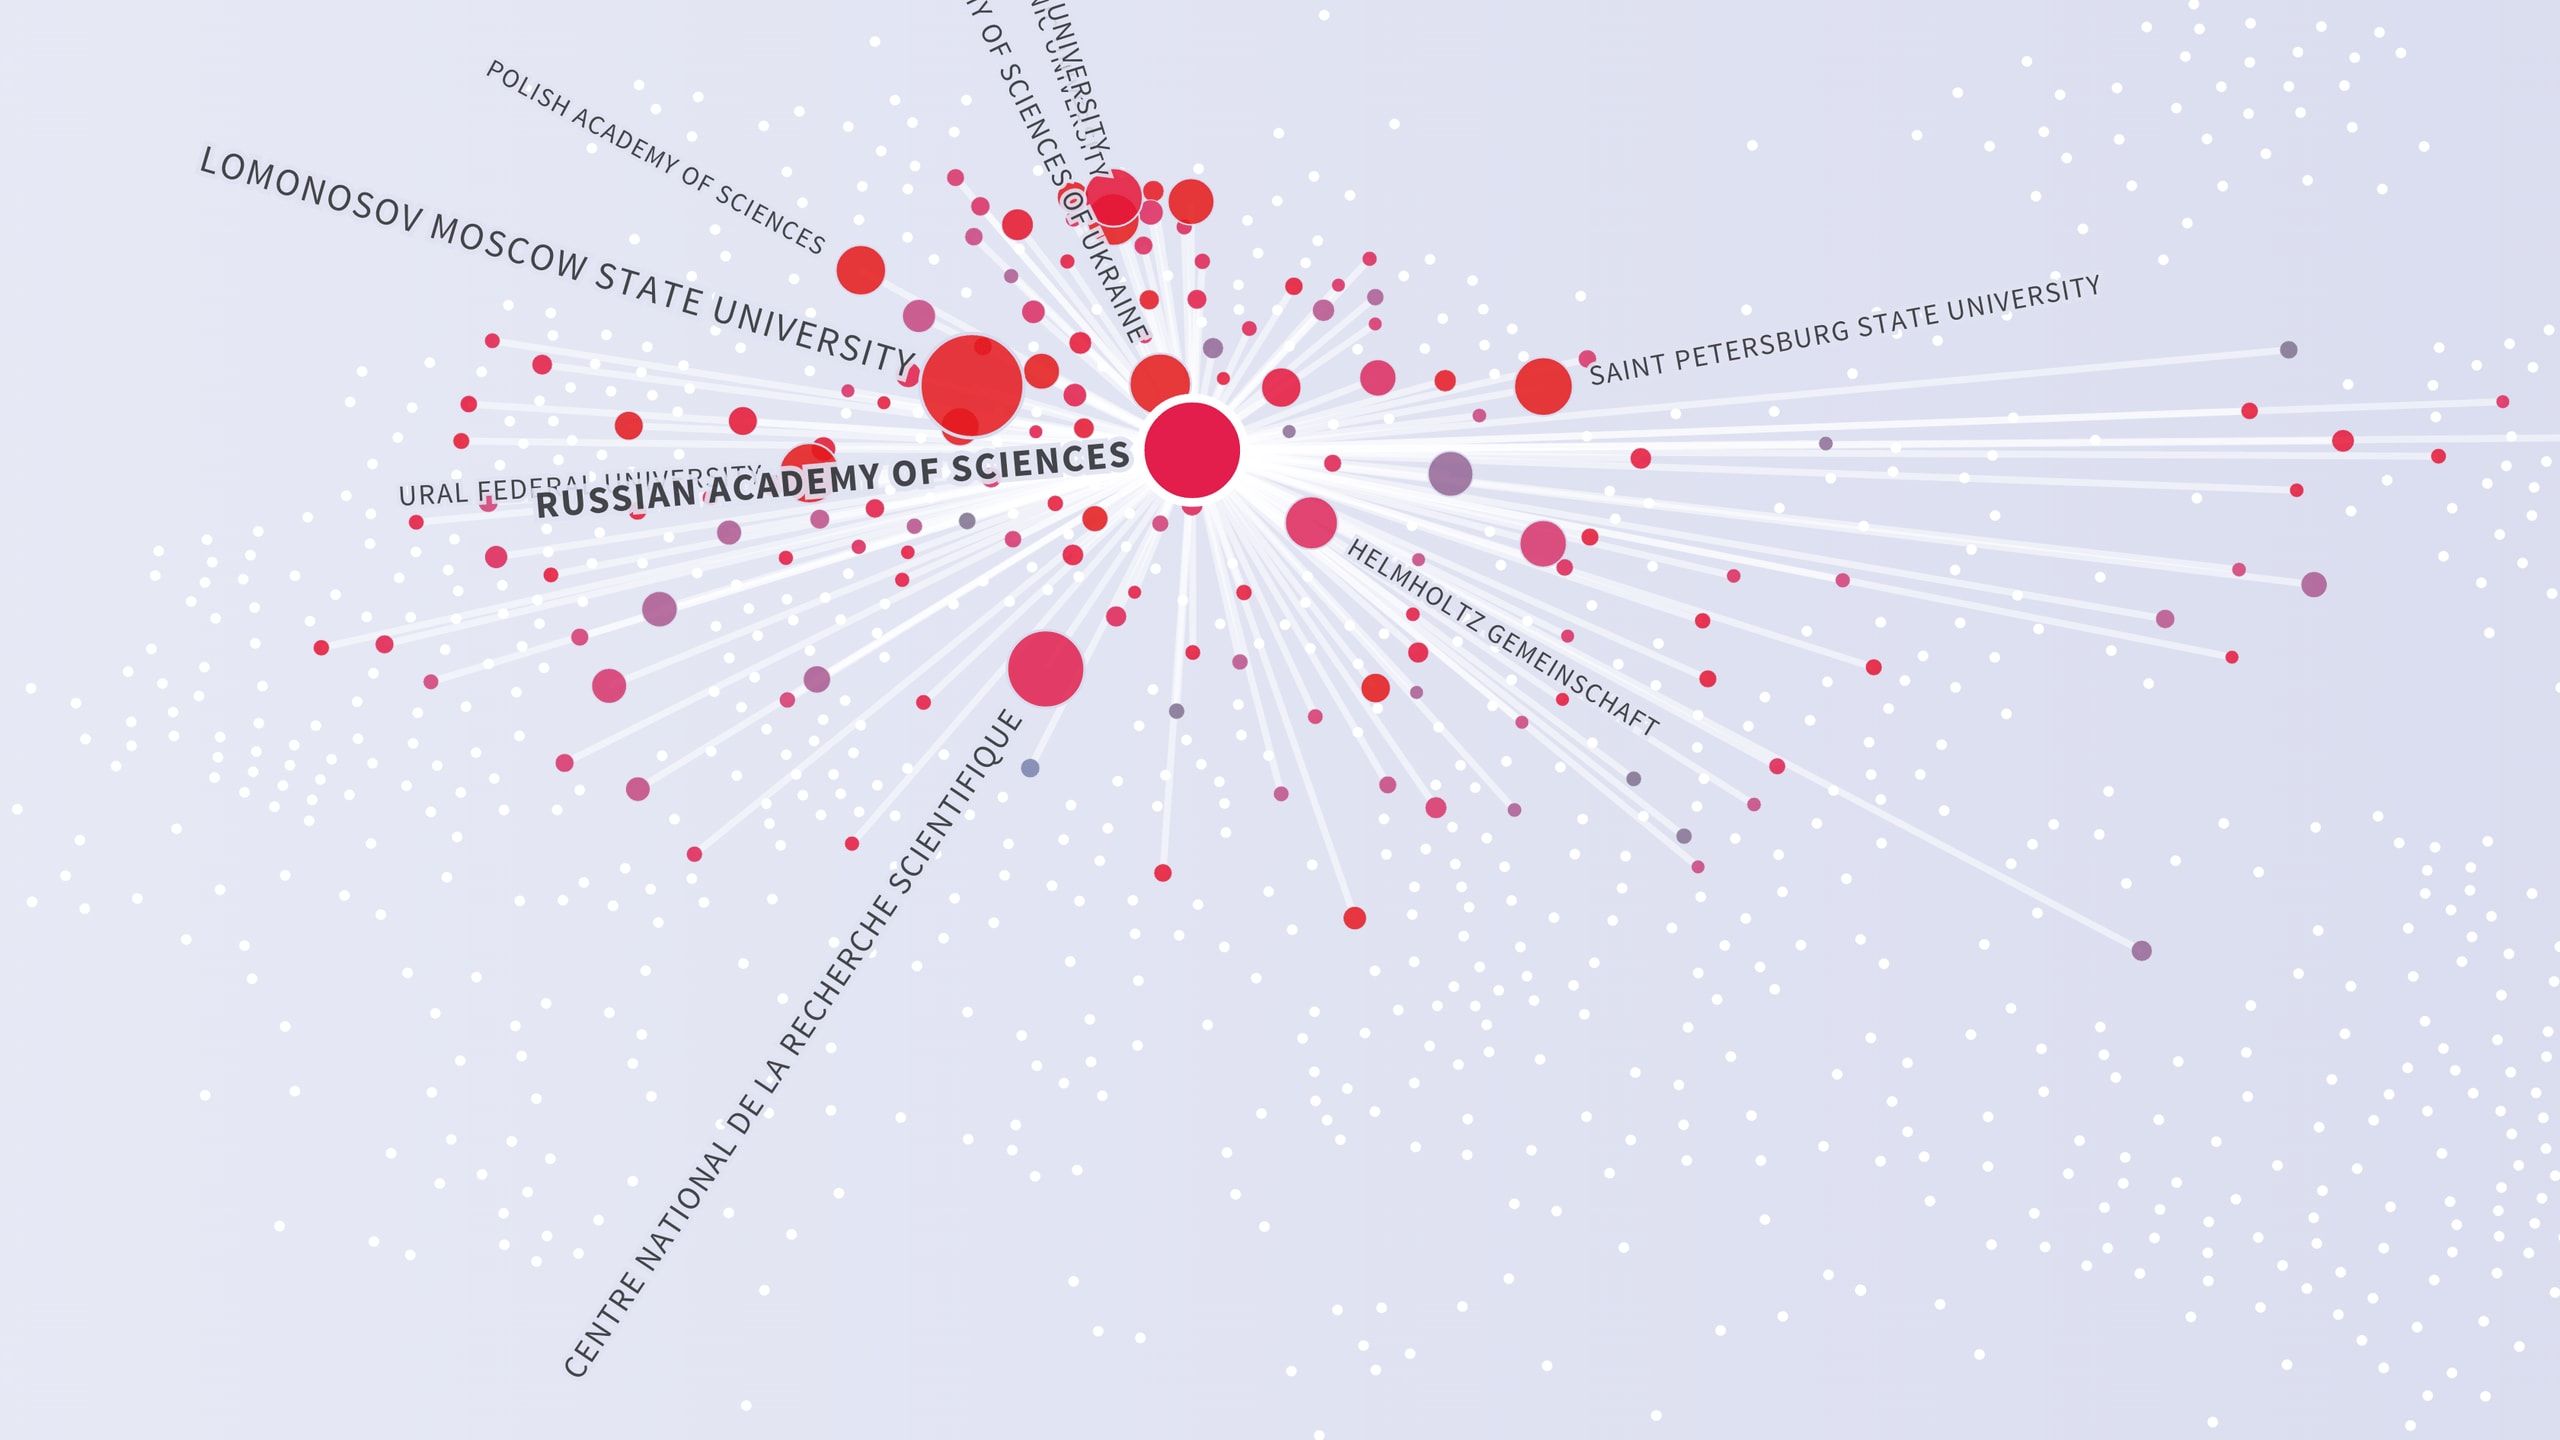
The application is based on papers (articles, reviews and conference papers) published between 2007 and 2011 in 17 subject areas. For each subject area, those institutions (universities and research-focused institutions worldwide) were selected in the SCImago Institutions Ranking which published at least 500 papers in the publication period. We then estimated statistical models (Bayesian multilevel logistic regressions) for the 17 subject areas. The statistically estimated best paper rates which the reference institutions have achieved with its network institutions are visualized. The best paper rate gives the proportion of highly cited papers from an institution and is considered generally as a robust indicator for measuring citation impact. Co-authorship networks (based on institutional affiliations) show how successfully overall an institution (reference institution) has collaborated compared to all the other institutions in a subject area, and with which other institutions (network institutions) an institution has collaborated best.

Insitutions are colored by the probability that their papers are cited by others. The application allows to investigate if and how that probability changes when specific institutions collaborate.

