Lilienthal Solargraphy
Physical data recording
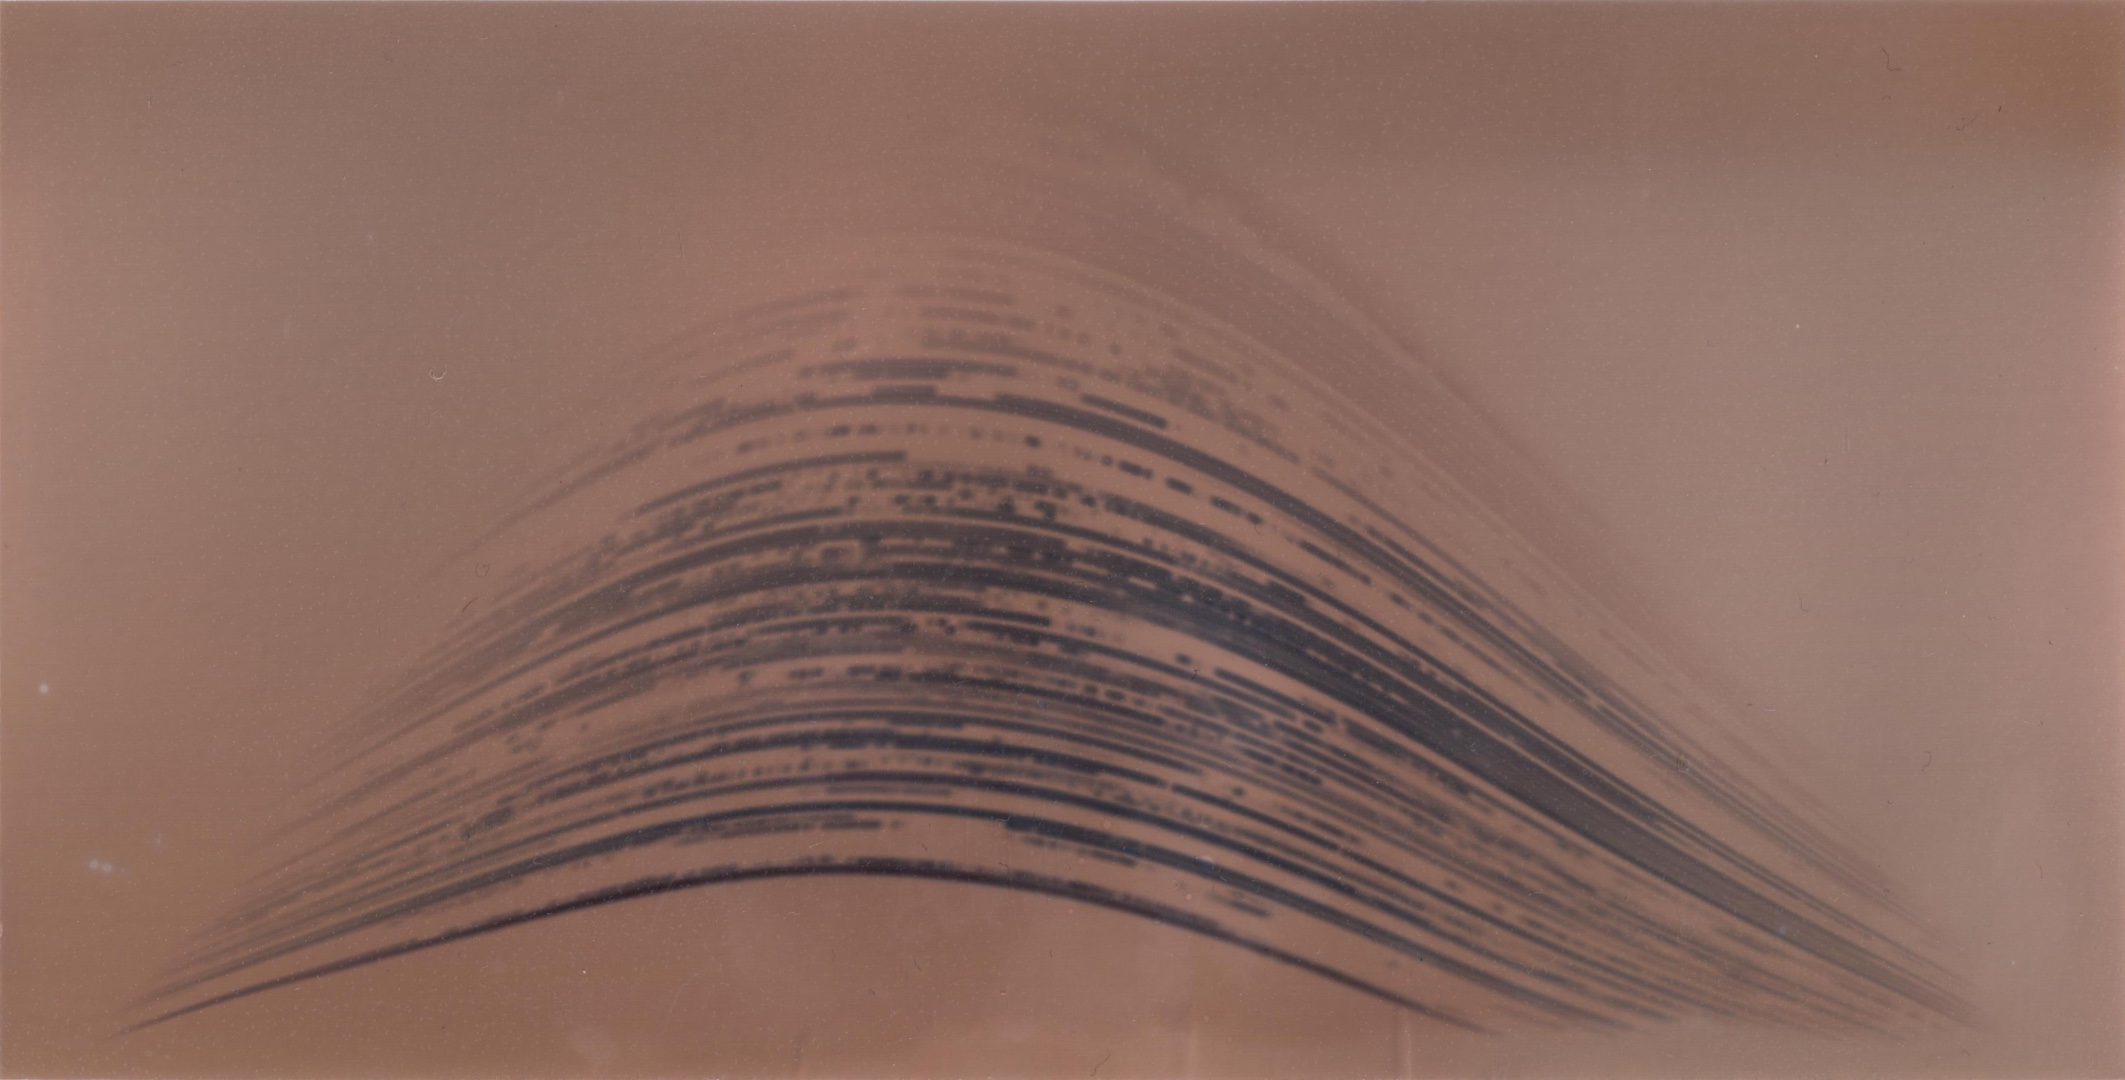
I create images of the sunlight using pinhole cameras at my home in Lilienthal, Germany. This image presents a graphical recording of the sun’s position and strength over the course of 6 months in the second half of 2022.
Exploring data-less, autographic visualizations bears a fascination for me, as it allows us to explore materiality and process behind data graphics in new ways. As a personal experiment, I set up pinhole cameras to capture the sun's light over the course of 6 months. The resulting images are diagrammatic in nature, but were created without any data, merely through a specific physical setup.


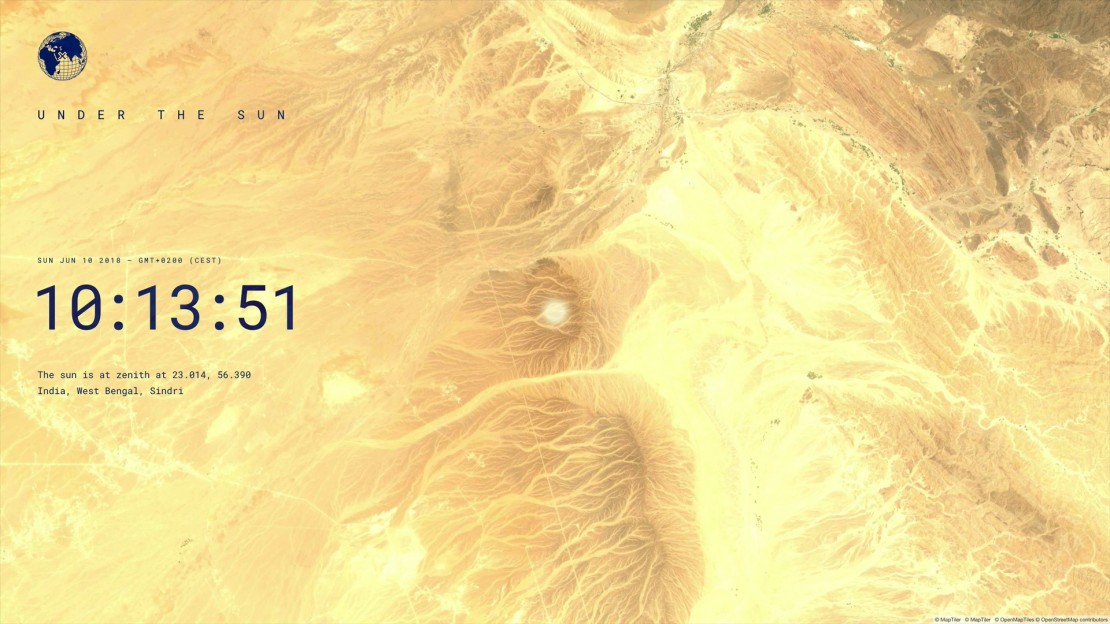
Mathias Stahl has created remakes of the images using code. It is interesting to compare the relative qualities of the two approaches.


