A Hidden Infrastructure
The globe

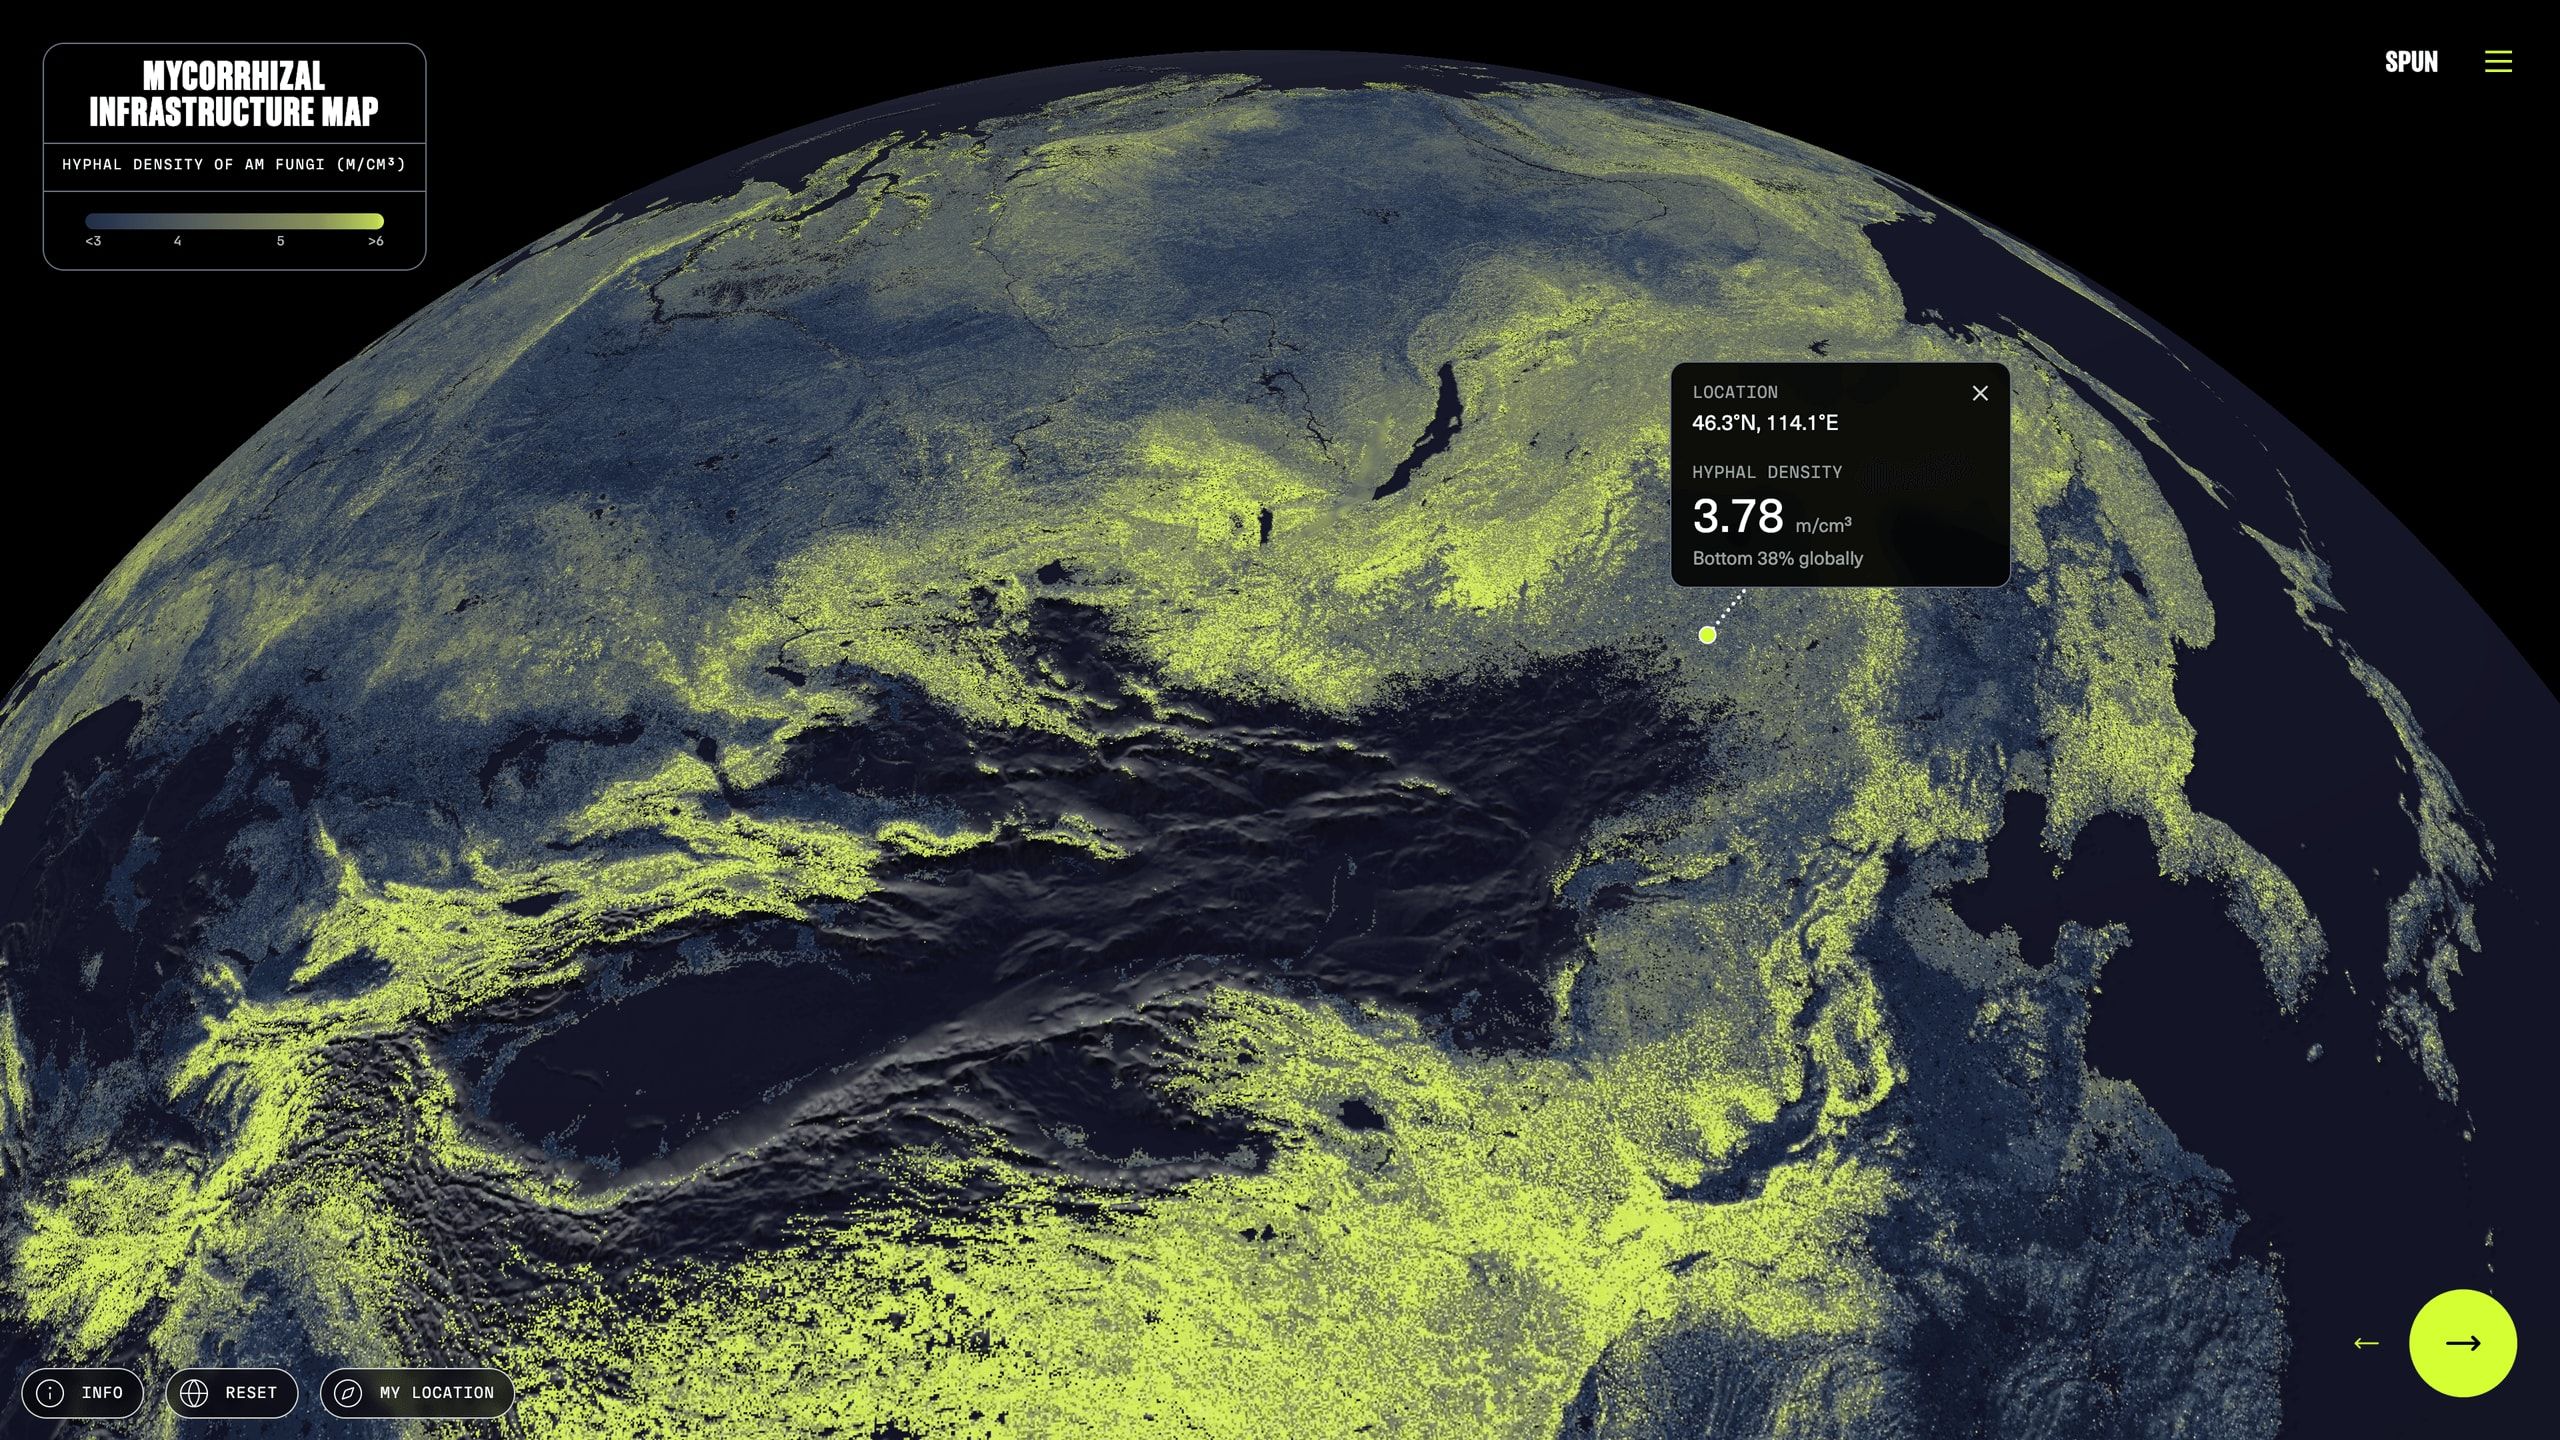
Working with SPUN and their international research team, I designed the project’s centerpiece: an interactive 3D globe paired with a long-form story.
The globe renders the predicted density of fungal networks at 1 km × 1 km resolution across the whole planet — a continuous, glowing skin of living infrastructure grounded in 16,000 soil cores and robotic imaging of 300,000 living hyphae.
The initial timeline for the project was very ambitious, so, quite unusually, the globe design and implementation were created pretty much one-shot, based on earlier design and technology explorations I had done independently already. Usually, I will advise towards a more extensive design exploration phase — but you also have to know when to seize opportunities that present themselves: When we saw the dataset in this form, in its striking beauty, and fascinating interplay with features like land use and elevation, we just knew we had to make it the centerpiece of the project.

Narrative
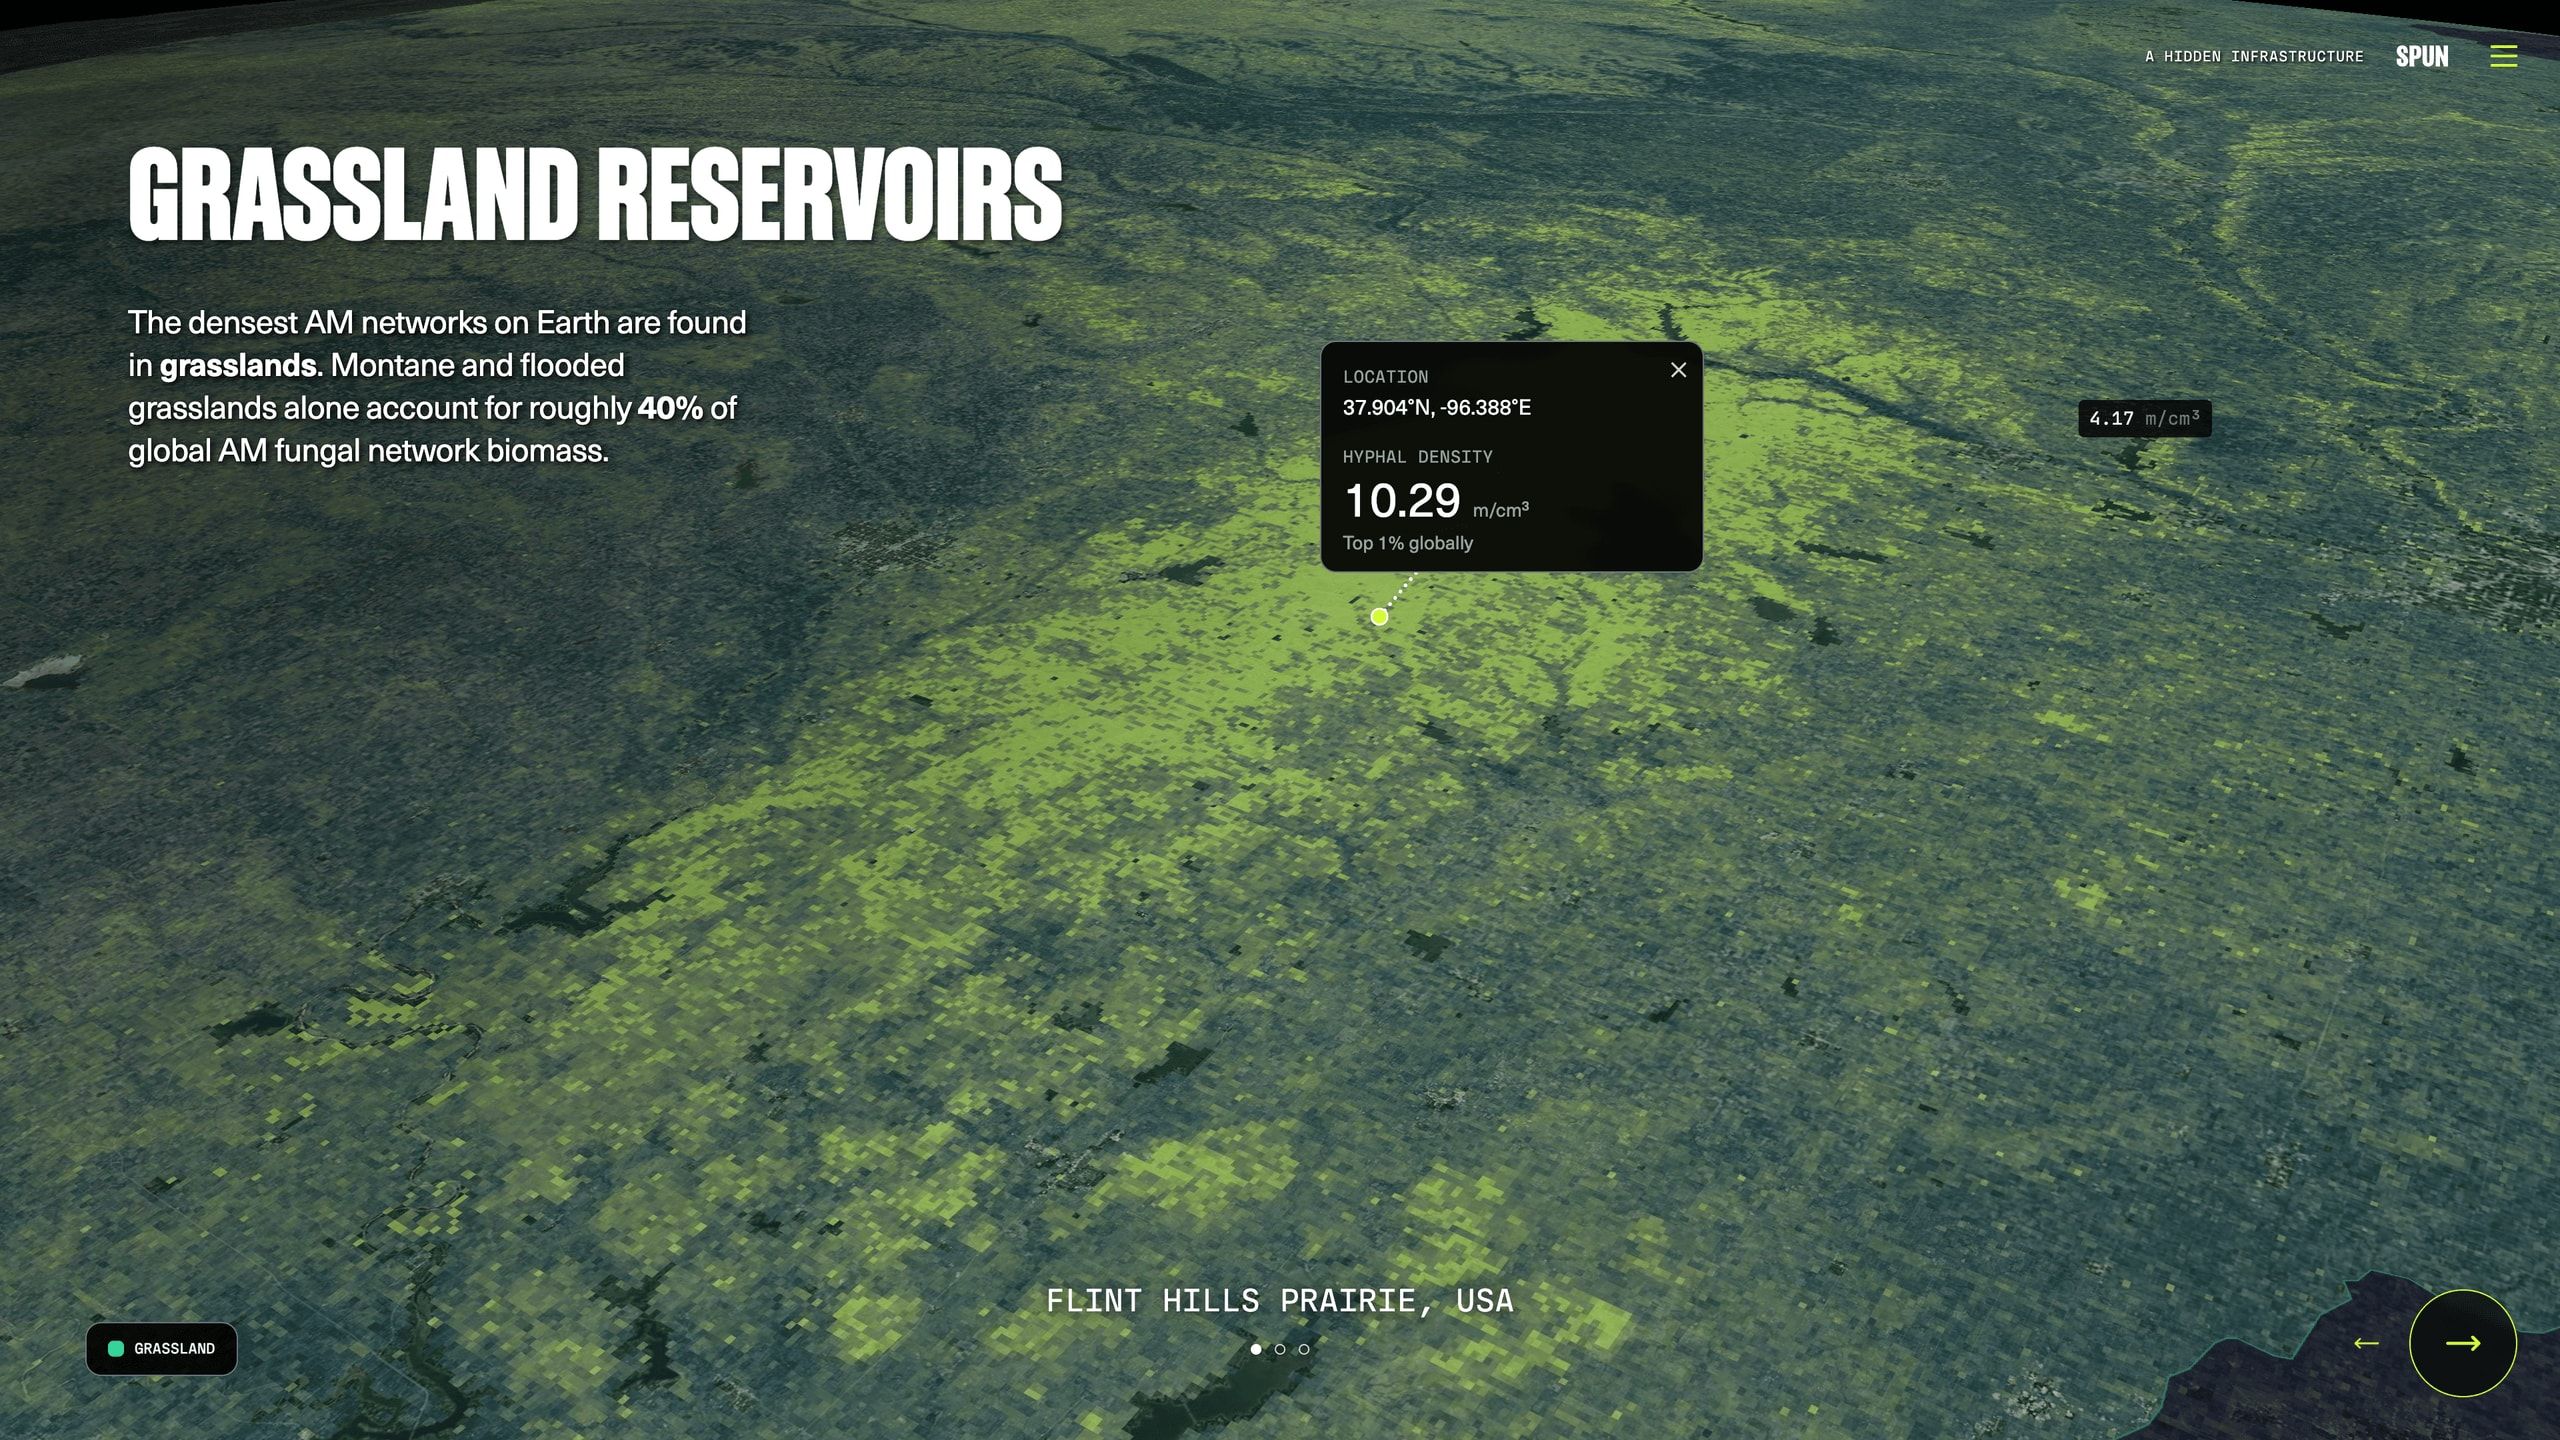
A striking key visual like this globe goes a long way — but in order to explain the motivation, and also nuances behind the data, we worked on a long-form story to accompany the globe.
It is structured in three main sections: the first one introduces the hidden world of fungi and the motivation for the project; the second one dives into the research process and the data itself; and the third one looks at the implications of this new knowledge for our understanding of ecosystems and how we can protect them.
We consciously avoided a “scrollytelling” long page format for the story, and rather went for a step-based, slide-presentation style. This allows to easily jump between sections, find orientation, and to integrate the interactive globe as a constant companion to the story.


Here’s a speedrun of the data visualization parts of the site:
Visual language
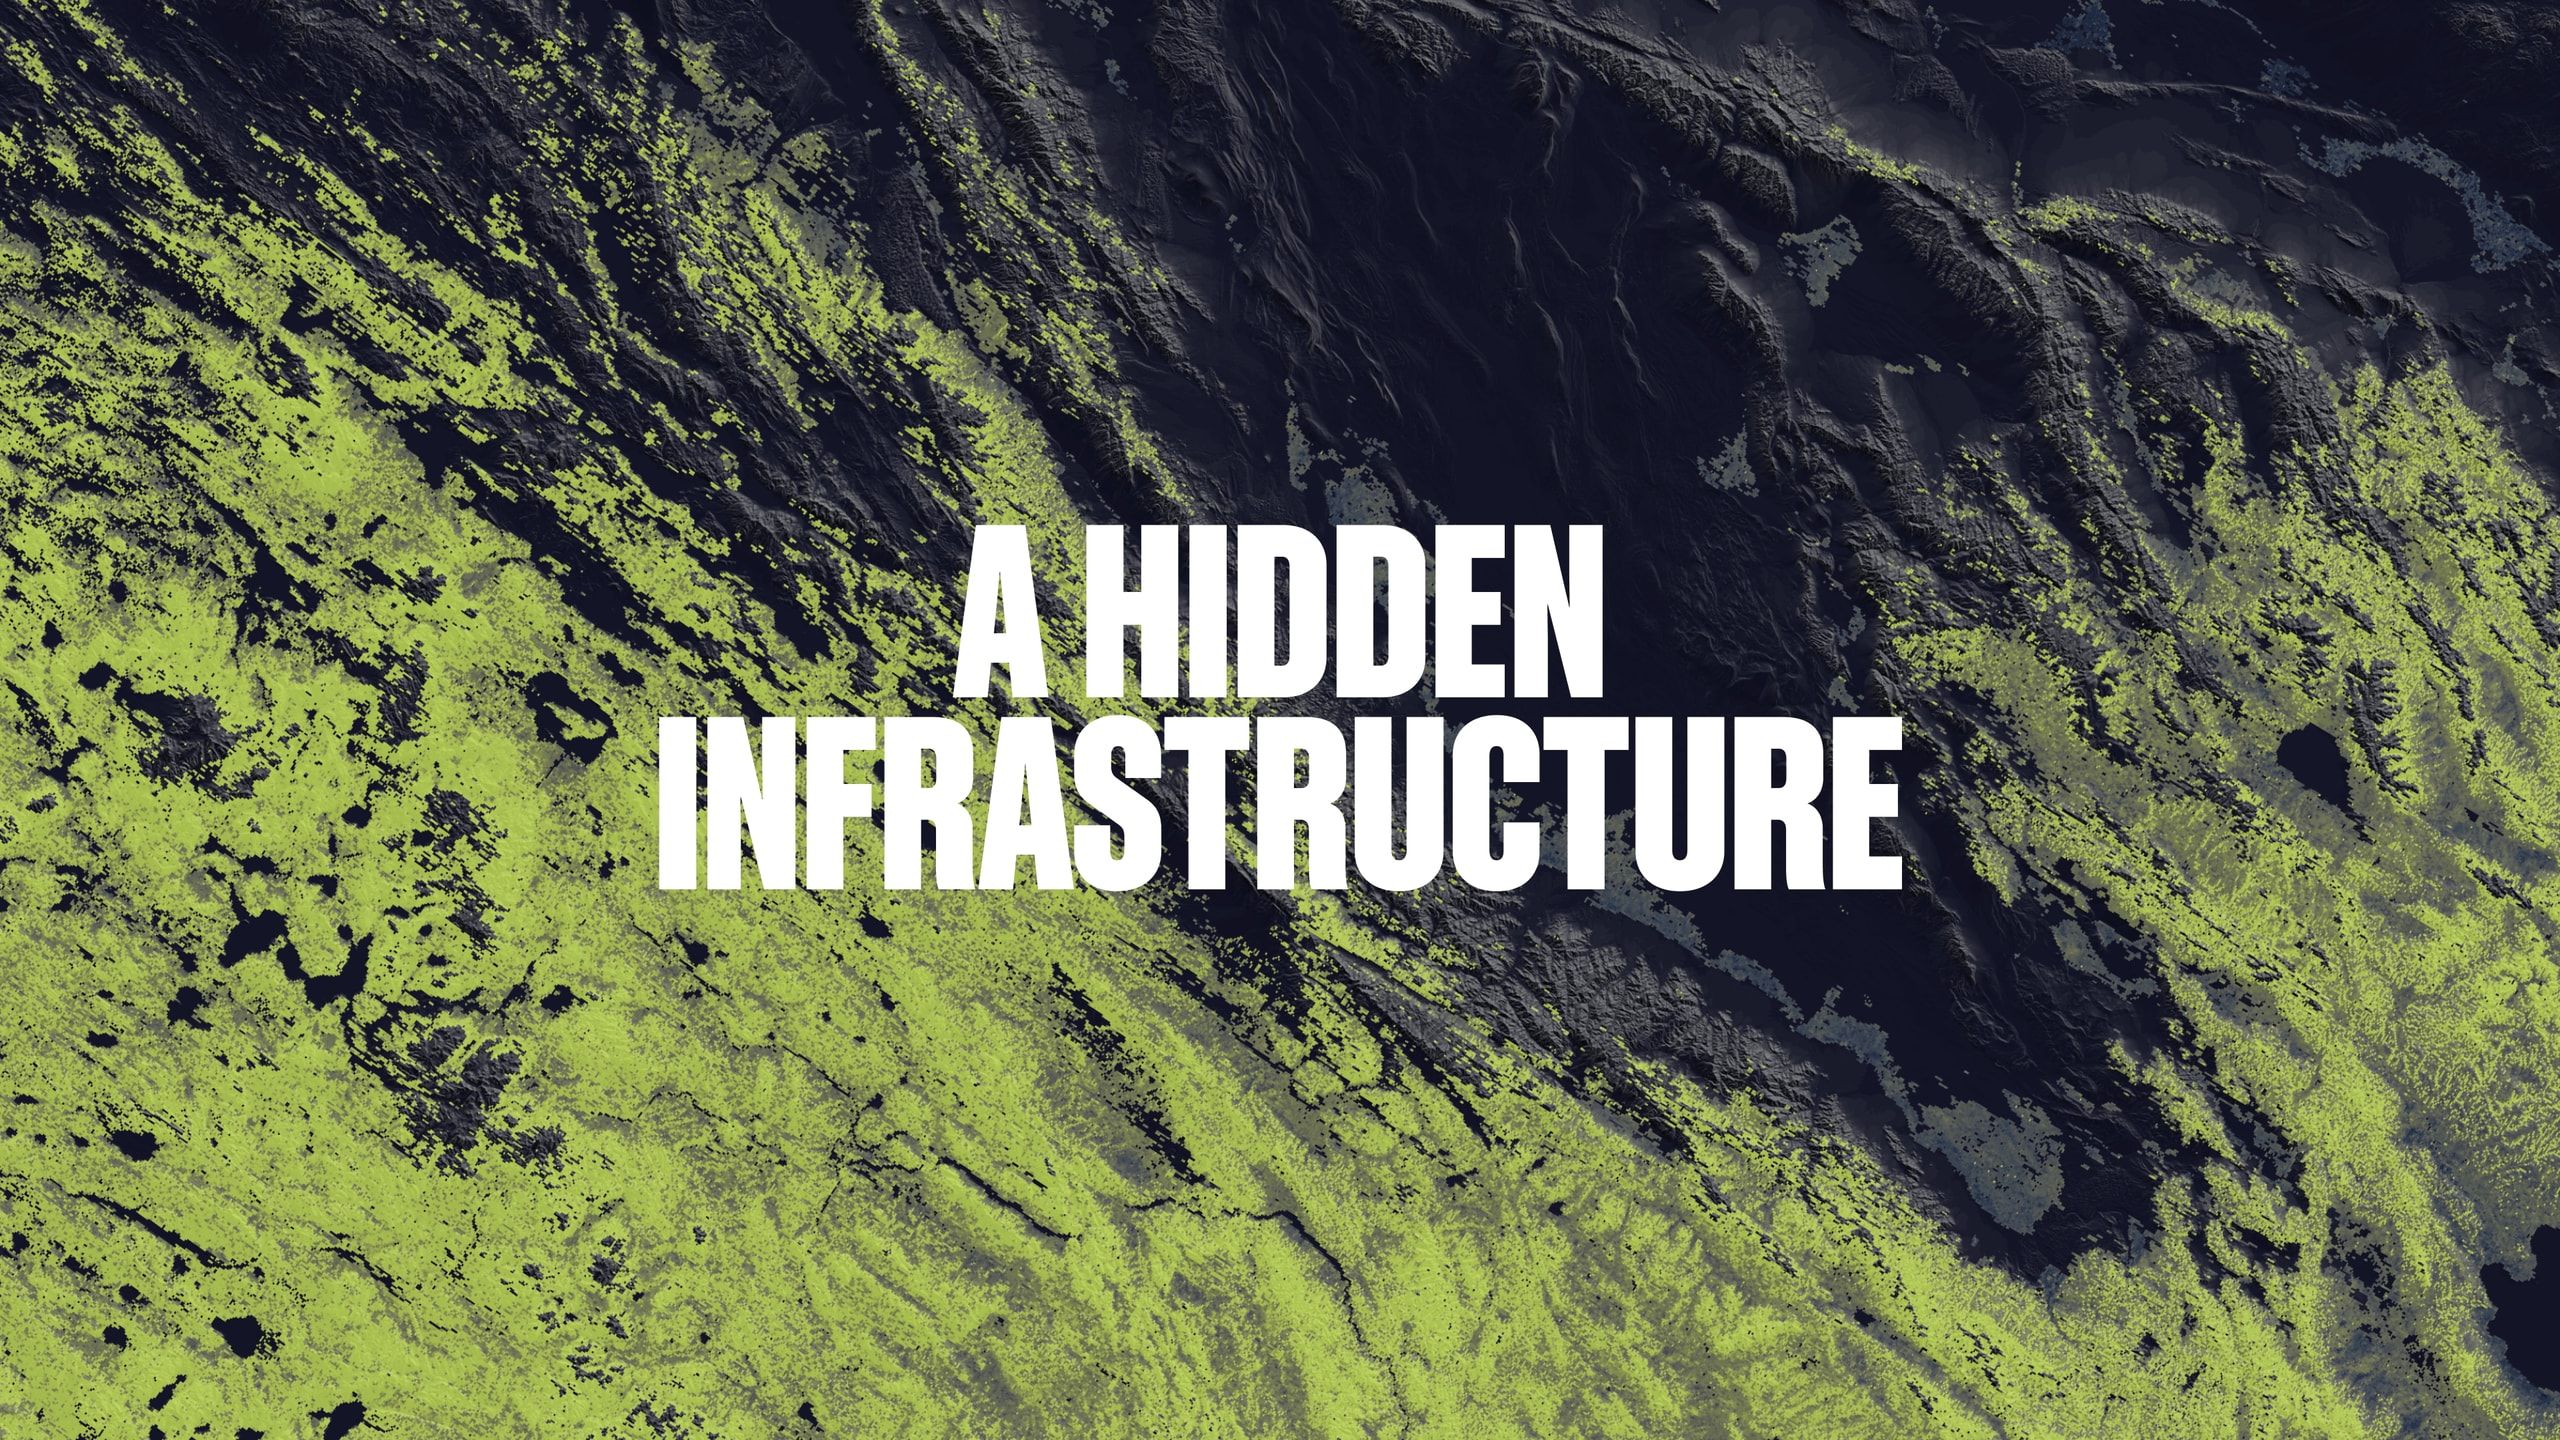
The visual impression of the globe is deliberately organic and otherworldly — mystic, almost alien — closer to looking at a living organism from orbit than reading a conventional dataset.
The UI and illustrations borrow from the clear and bold visual language of the SPUN brand, with a focus on clarity and legibility.
Specific illustrations were created to visualize, for instance, the staggering total numbers and the algorithmic mechanisms behind the dataset. For other parts of the story, video and photo material was available to provide a more human perspective on the research process and the scientists behind it and show all the on-the-ground work that needs to come together.


Tech notes
The application was built using SvelteKit and uses an end-to-end open source stack for the interactive vector maps, in particular:
- MapLibre GL JS — WebGL renderer for vector and raster map layers
- Protomaps basemap, served as PMTiles — a single-file tile archive read directly via HTTP range requests
- Hyphal-density raster served as a Cloud Optimized GeoTIFF and read in the browser with geotiff.js for per-pixel value lookups.

Reception
We received widespread media coverage, including:
- The New York Times: 68 Quadrillion Underground Miles of Fungi
- The Guardian: Subterranean fungi networks more than 100 quadrillion km in length, study finds
- National Geographic: Fungi take up more mass than people—see how they stretch across the Earth
- Scientific American: See the Hidden Fungal Network So Big It Could Stretch to Proxima Centauri and Back
- Live Science: Earth’s underground fungal network is so massive, it would span 10% of the Milky Way, map reveals
- GEO: Forschende vermessen riesiges Pilznetzwerk im Boden der Erde
Check out the story and the globe — and learn more about the Society for the Protection of Underground Networks (SPUN) and their work to protect these vital ecosystems.
Related

GROW Soil Moisture Maps

Project Ukko
Project Ukko presents a novel way to spot patterns in seasonal wind prediction data. Understanding future wind conditions can become a crucial component block in supporting clean energy sources and climate change resilience.
Our visualization allows energy traders, wind farm managers and others to spot global patterns and trends in future wind conditions, and drill into detailed prediction breakdowns on a regional level.