GROW Soil Moisture Maps
Empowering growers with soil moisture data models
The GROW Observatory is a European-wide project engaging thousands of growers, scientists and others passionate about the land. We developed the Dynamic Soil Moisture Map as a demonstration of an information service which could be used by farmers, scientists and policy makers for applications in agriculture and climate forecasting. These maps use GROW sensor data combined with satellite data to generate a continuous estimation of water content over a terrain.
Screencast of the interface
How it works
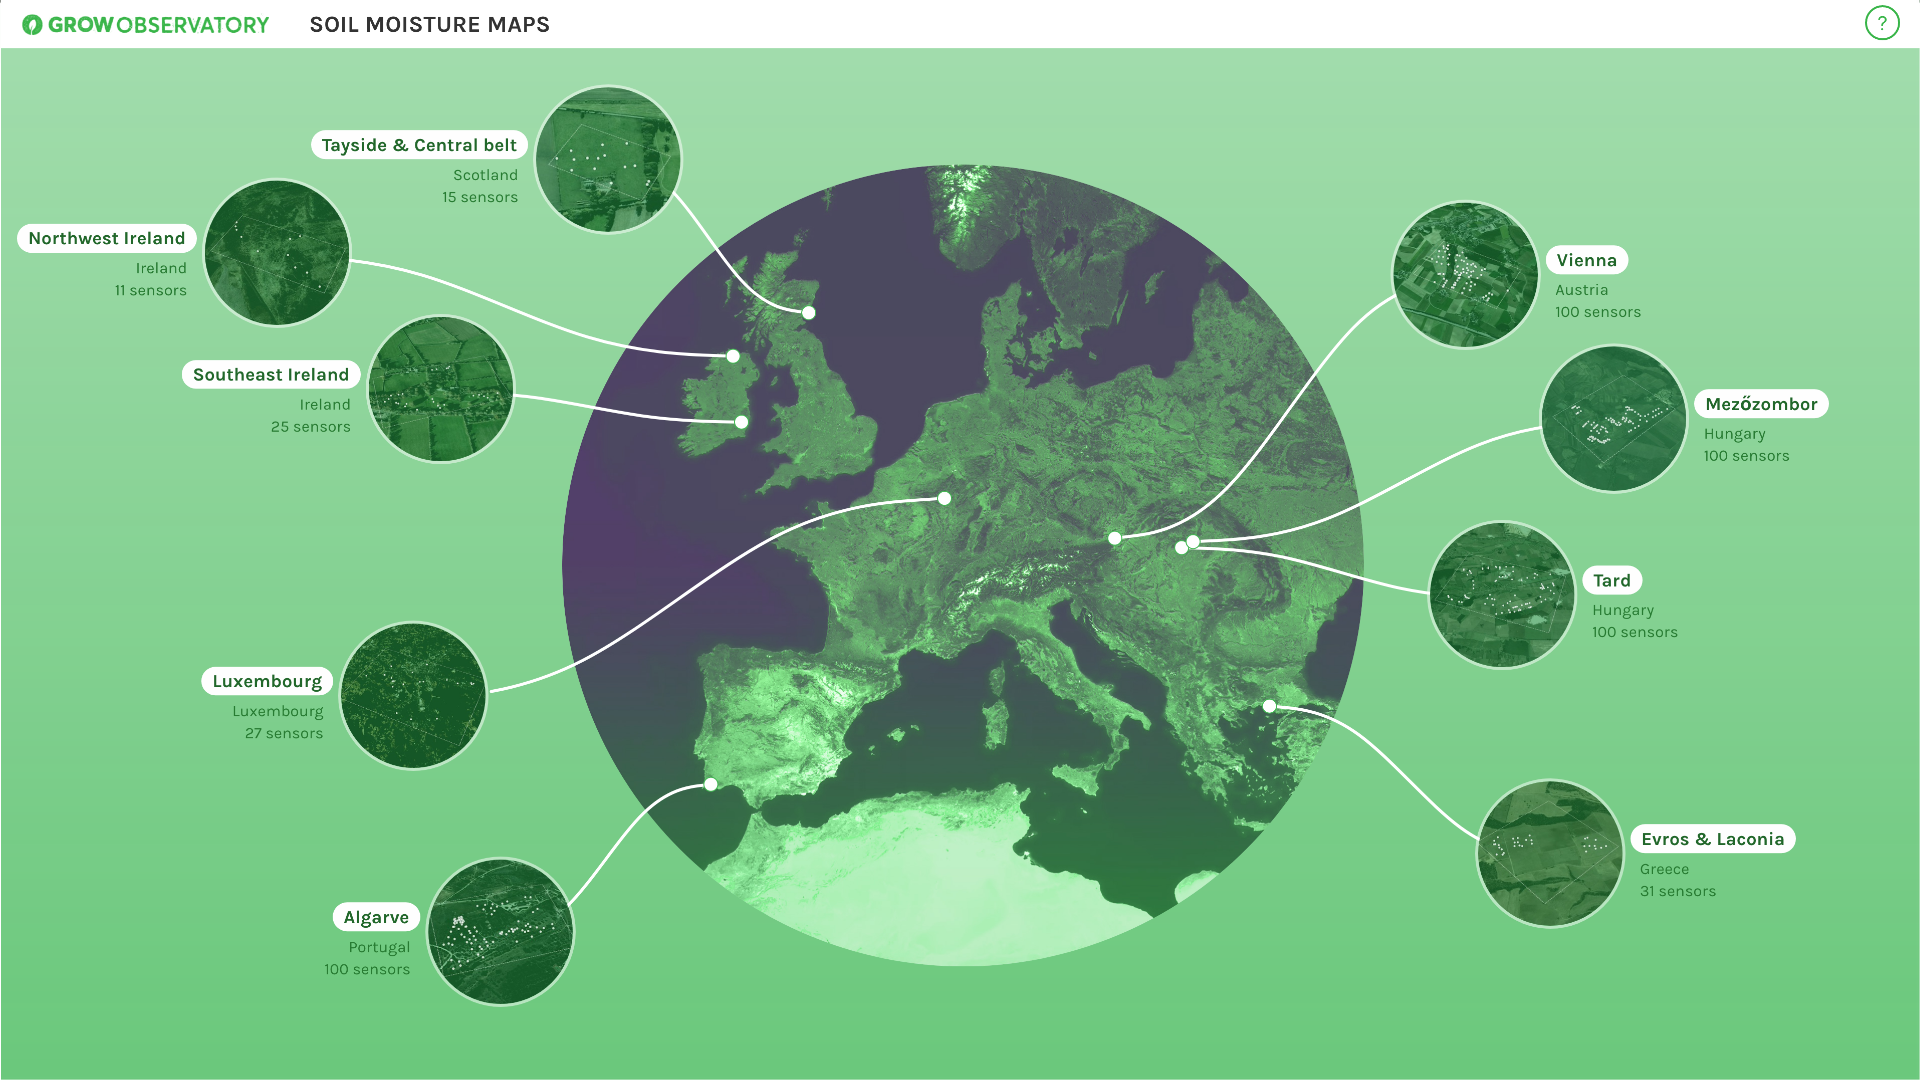
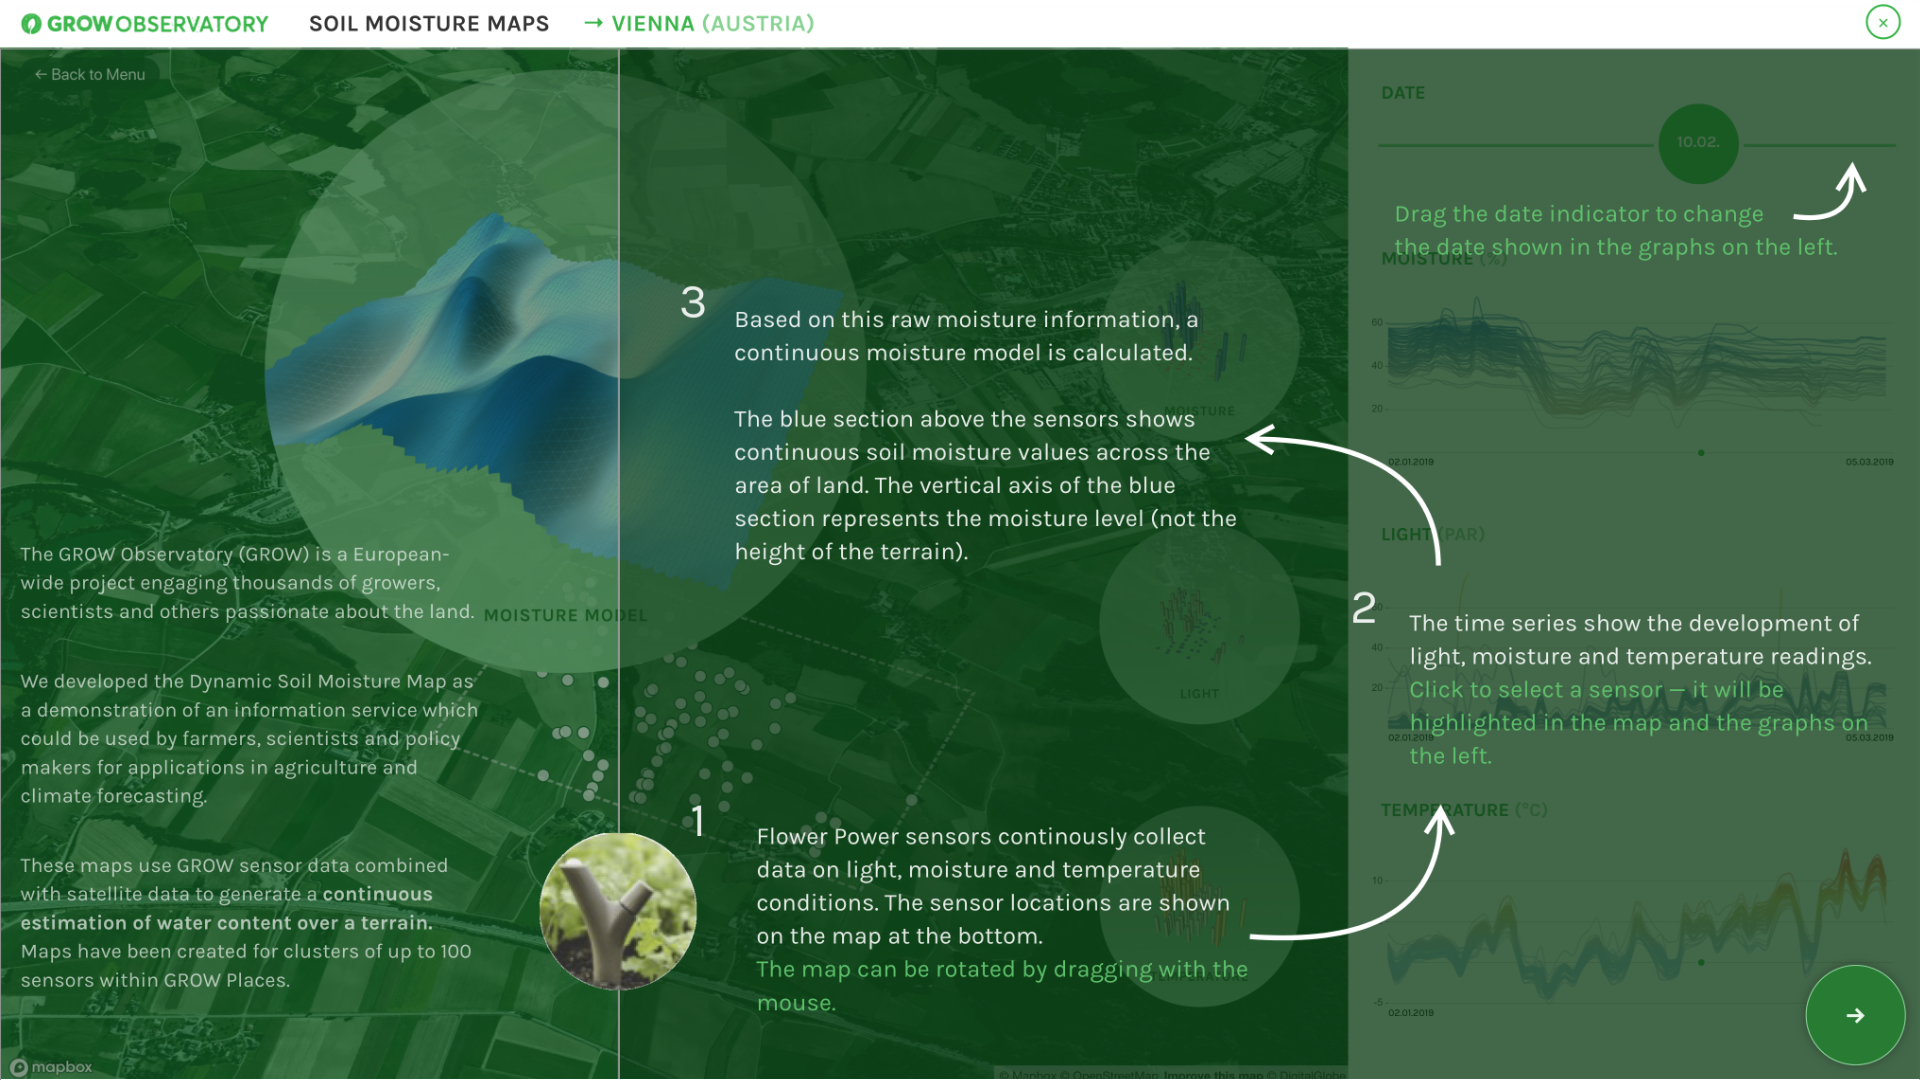
Local farmers and growers can install Parrot Flower Power sensors on their fields. These sensors continously collect data on light, moisture and temperature conditions.
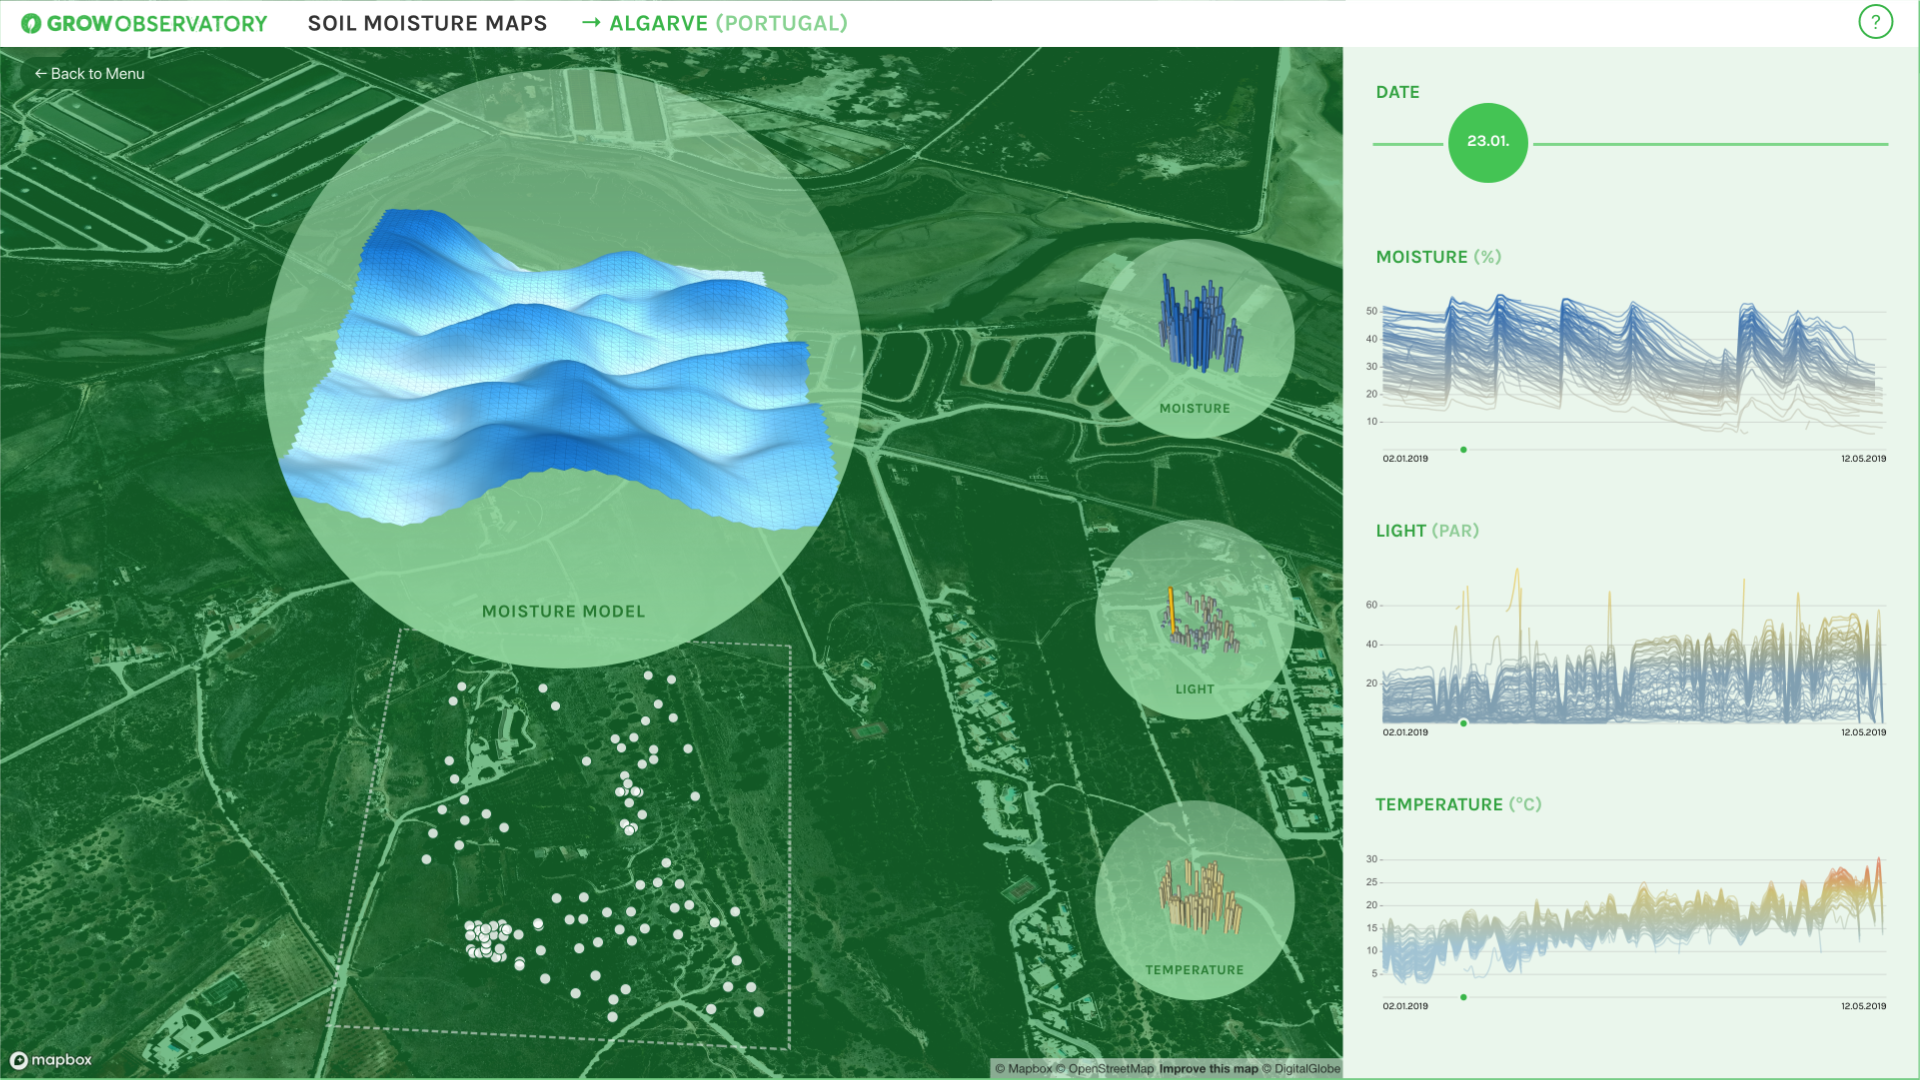
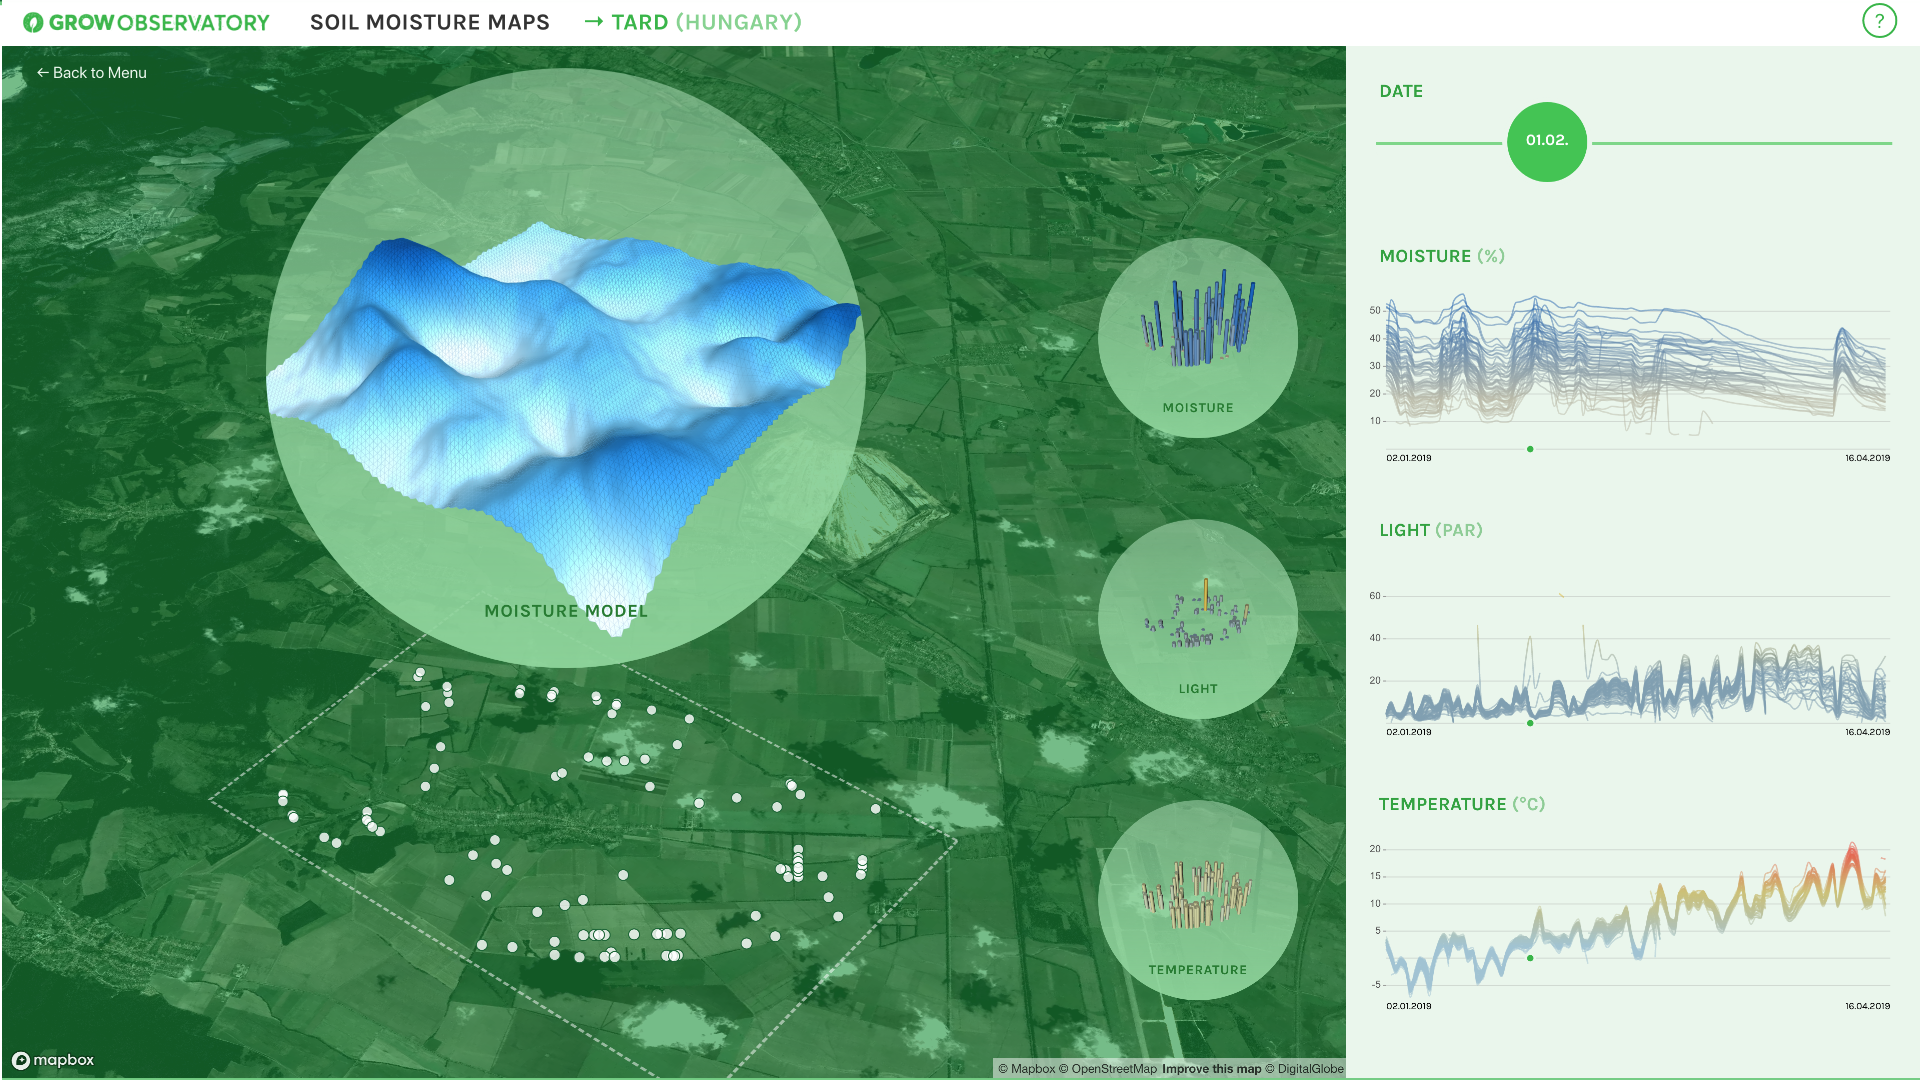
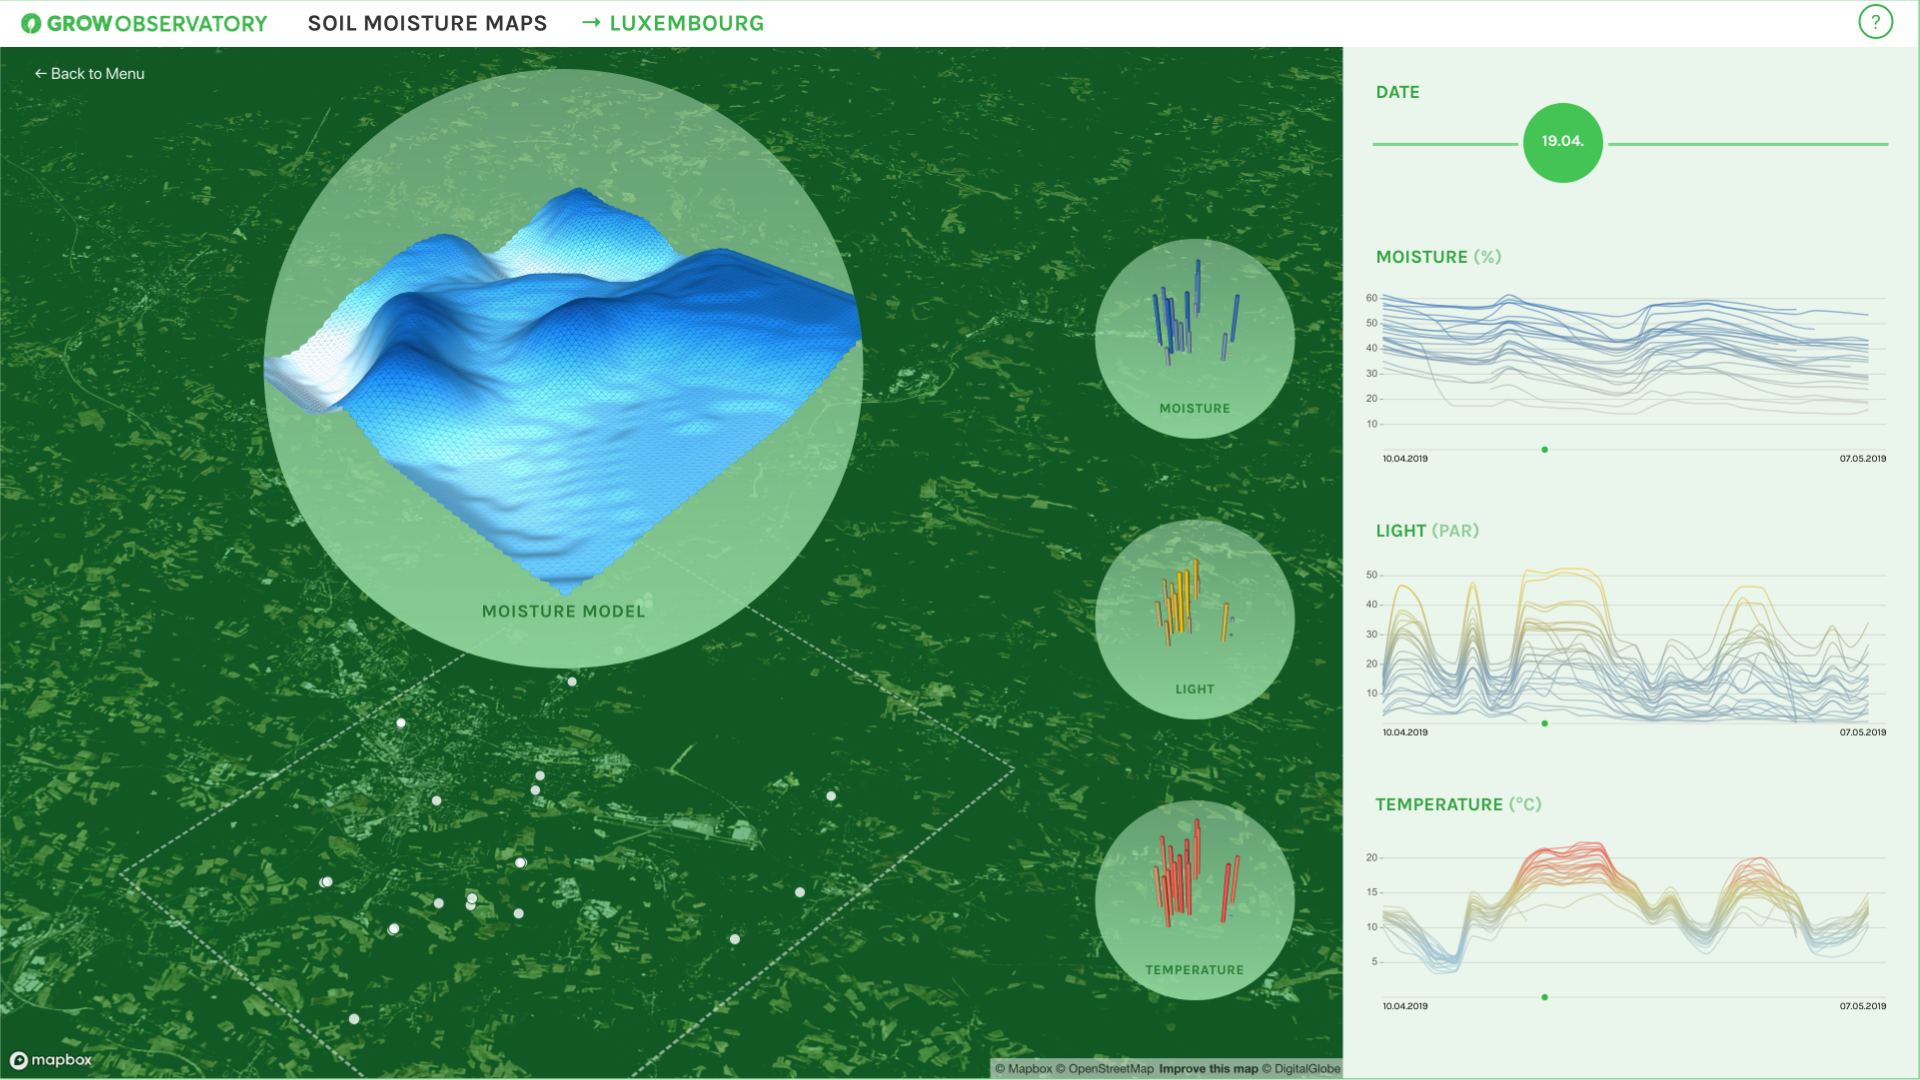
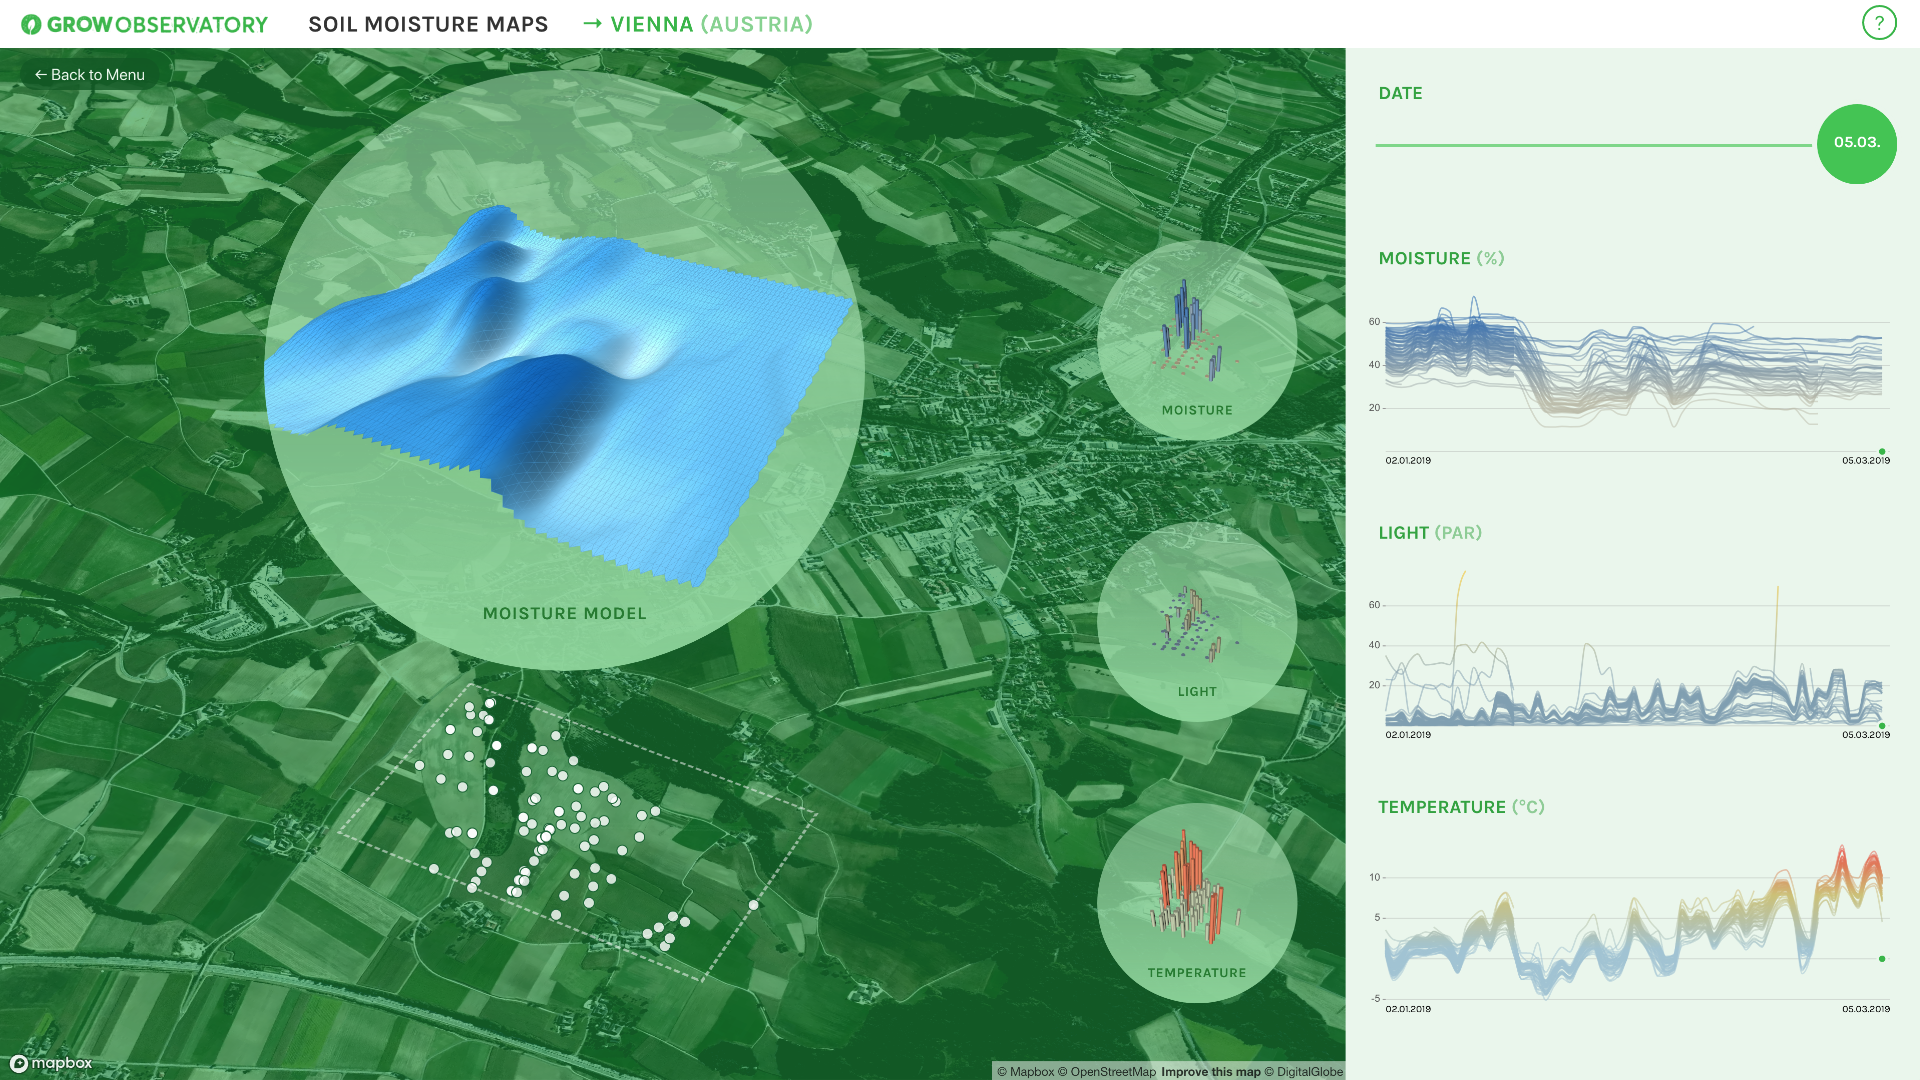
Once the user has selected a site of the exemplary GROW sites featured in the visualization, the sensor locations are shown on the map at the bottom. The map can be rotated by dragging with the mouse.
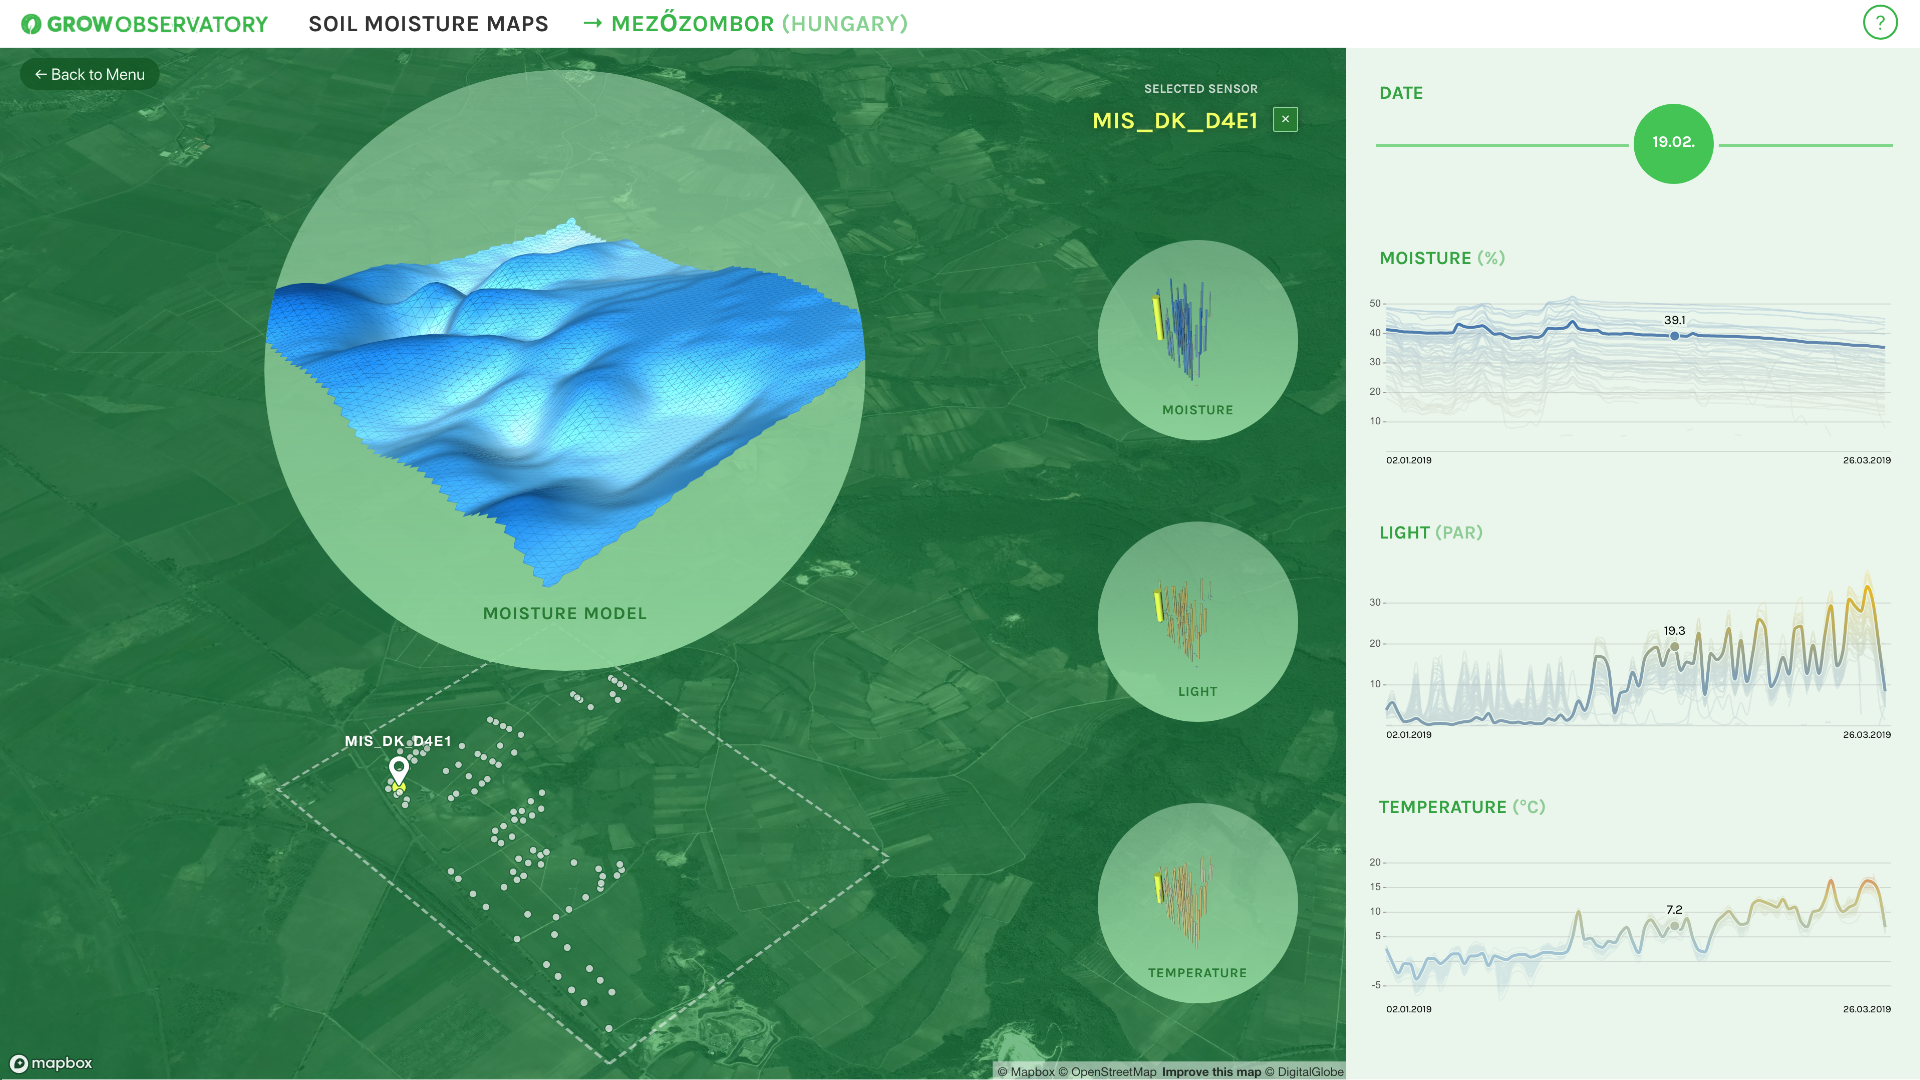
The time series charts on the right show the development of light, moisture and temperature readings. Click to select a sensor — it will be highlighted in the map and the graphs on the left.
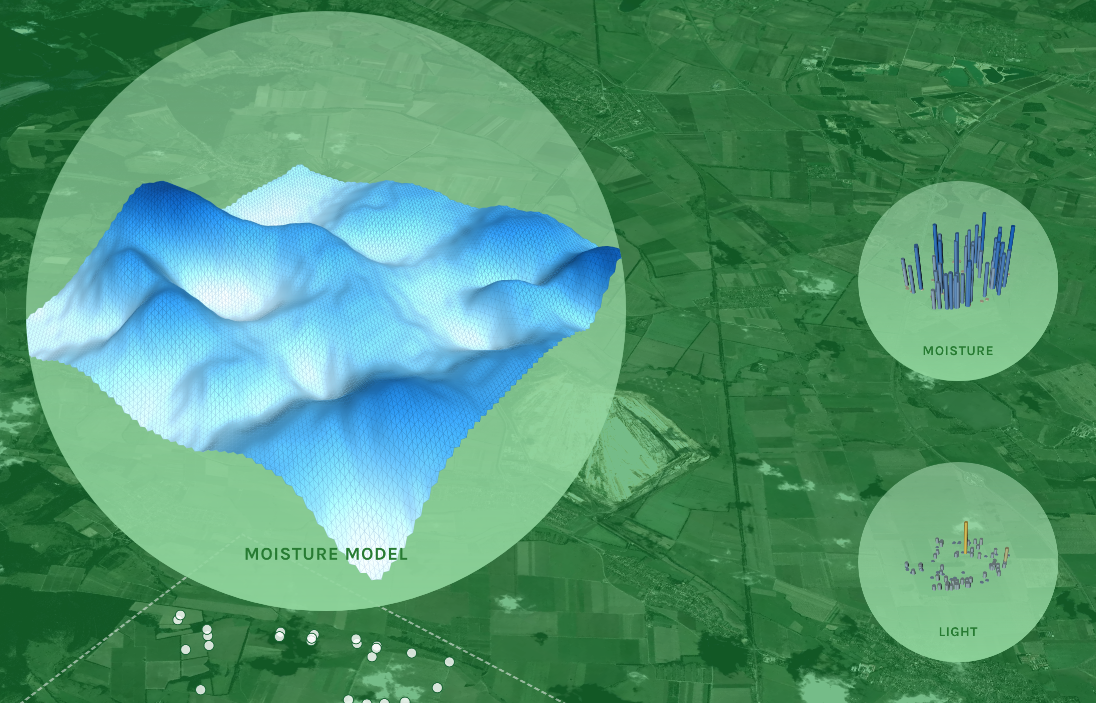
Based on this raw information from the sensors, a continuous moisture model is calculated for the whole surrounding area. The blue section above the sensors shows continuous soil moisture values across the area of land. The vertical axis of the blue section represents the moisture level. The "gridded carpet" look of the model is in contrast to the spiky columns of the sensor data visualization — in visual correspondance to the underlying process of continuous extrapolation from point-wise measurements.
Technical background
The web application was implemented using react, mobx, d3, mapbox-gl and three.js. The moisture model information is stored in geoTIFF files, while are loaded at runtime and transformed into 3D geometry using three.js.

