Image 1 of 7
Beyond the bar chart
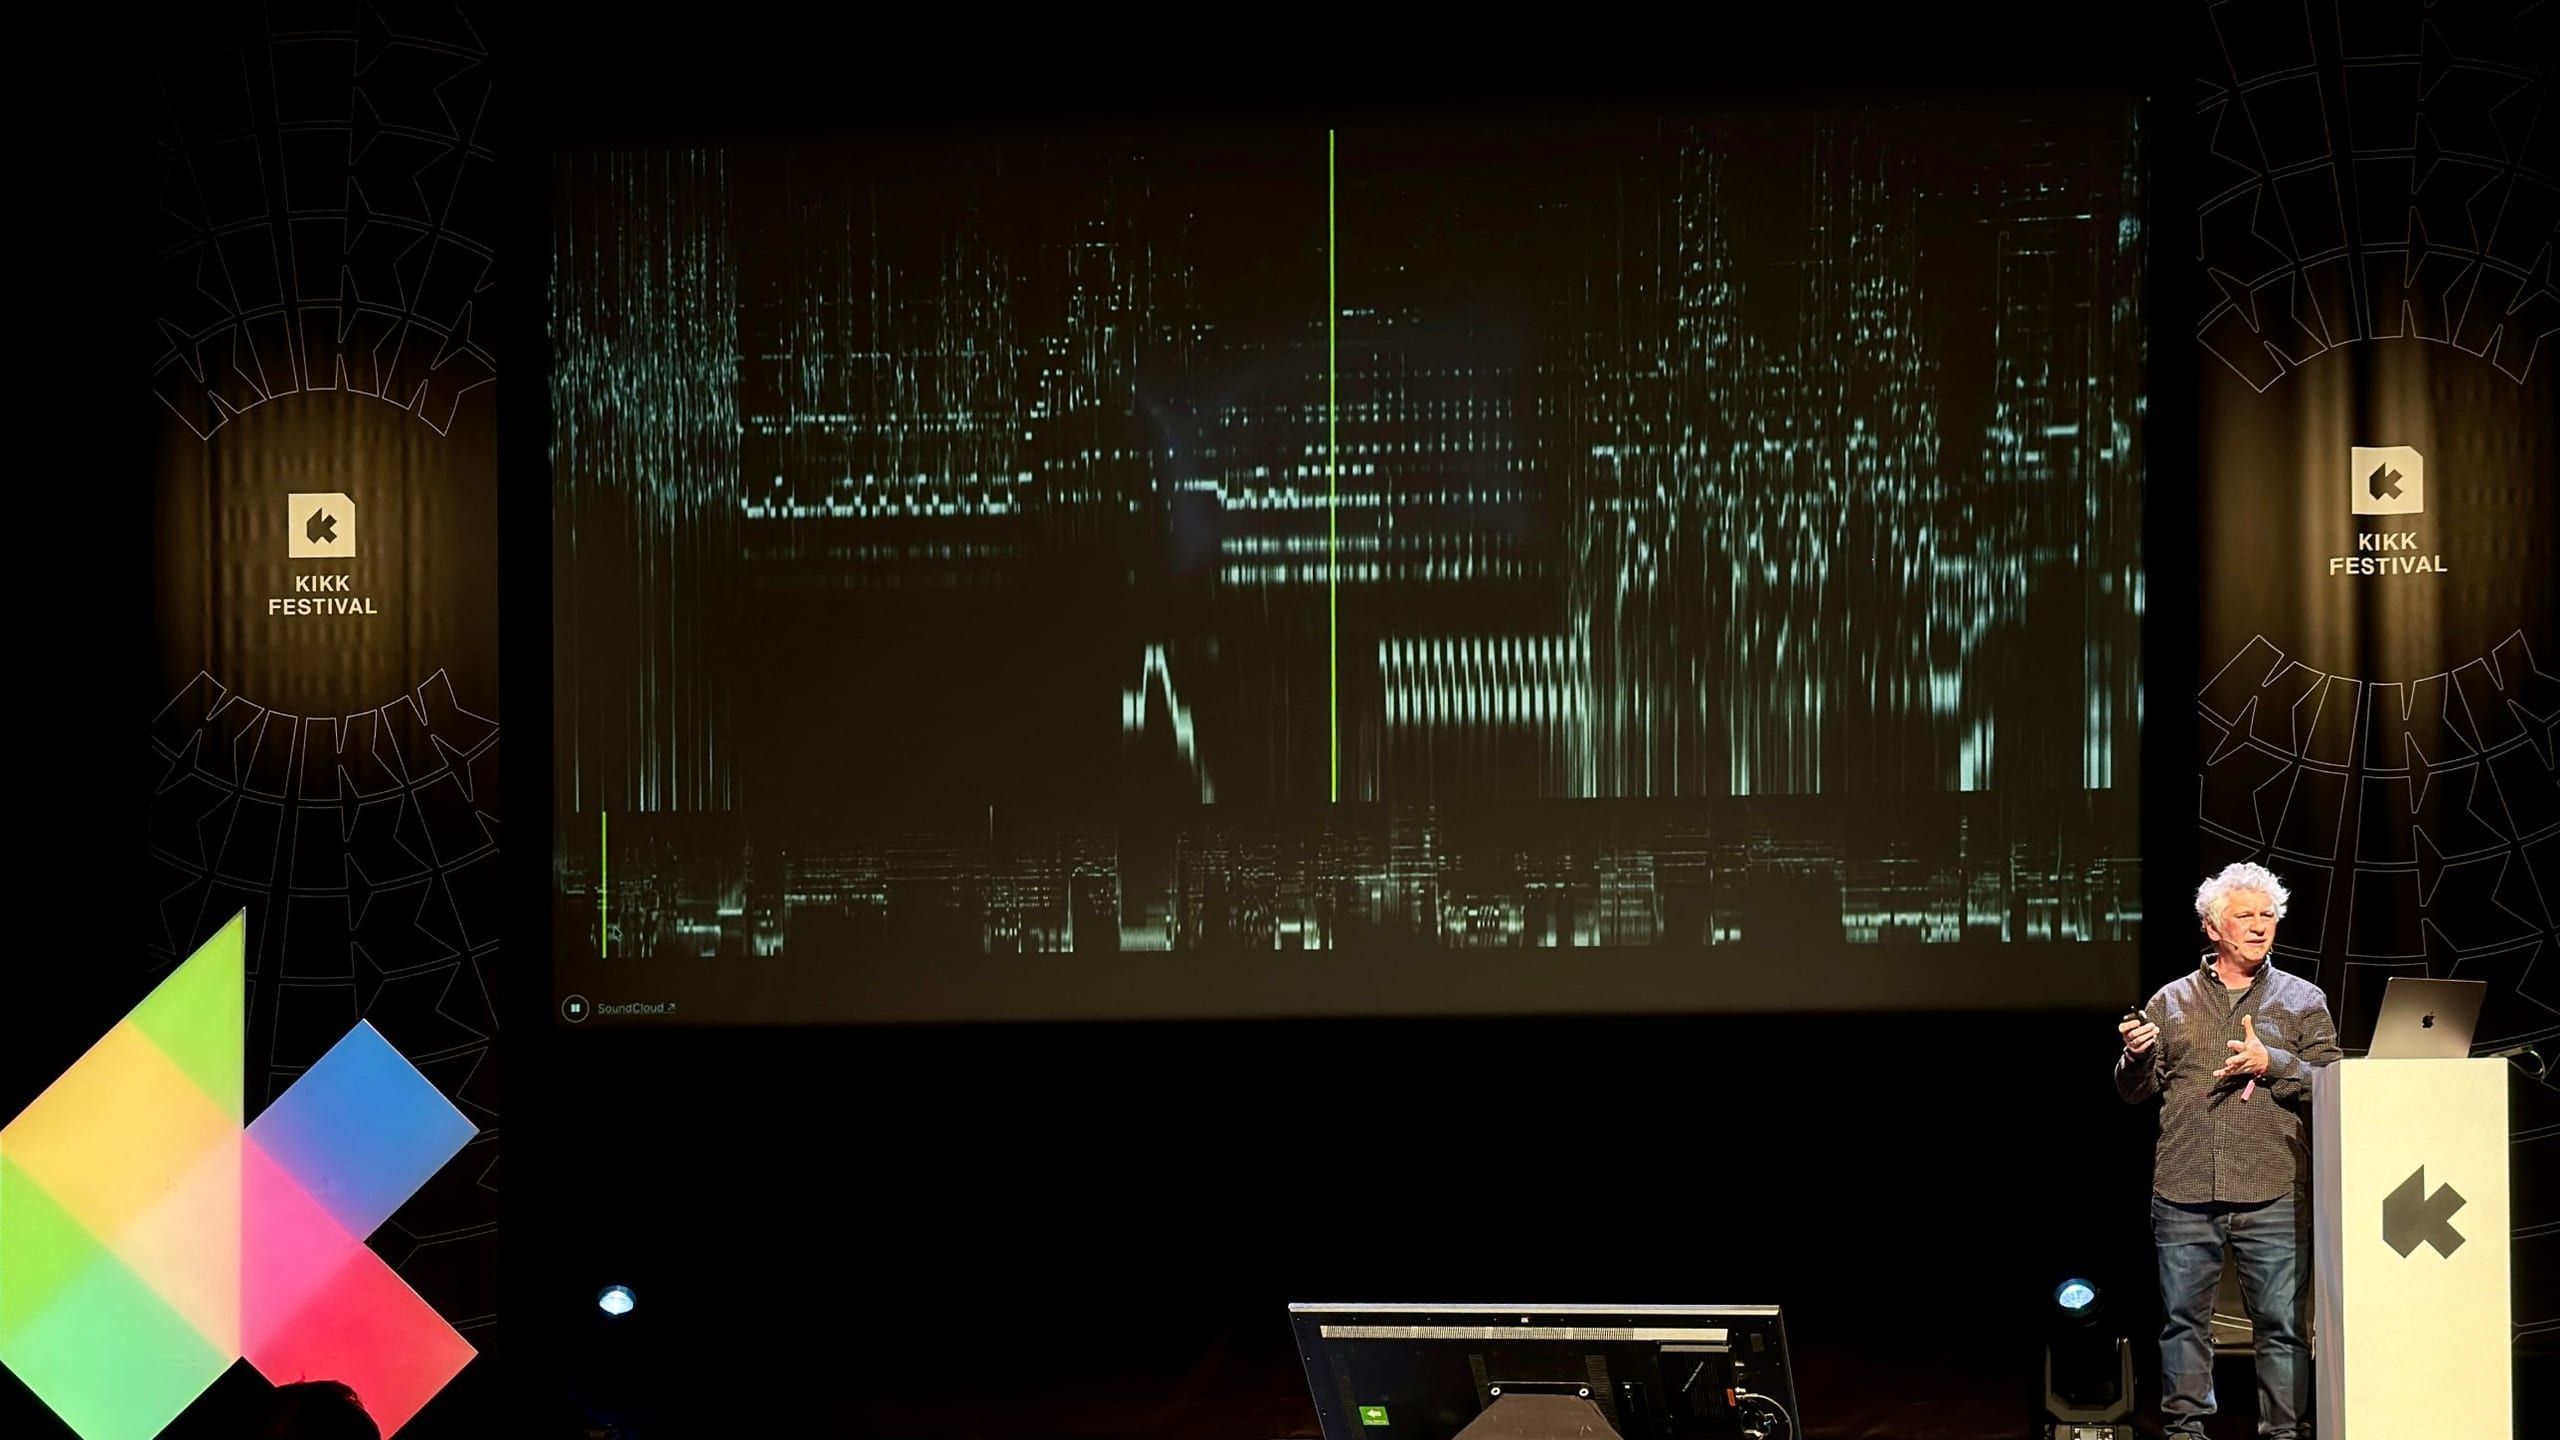
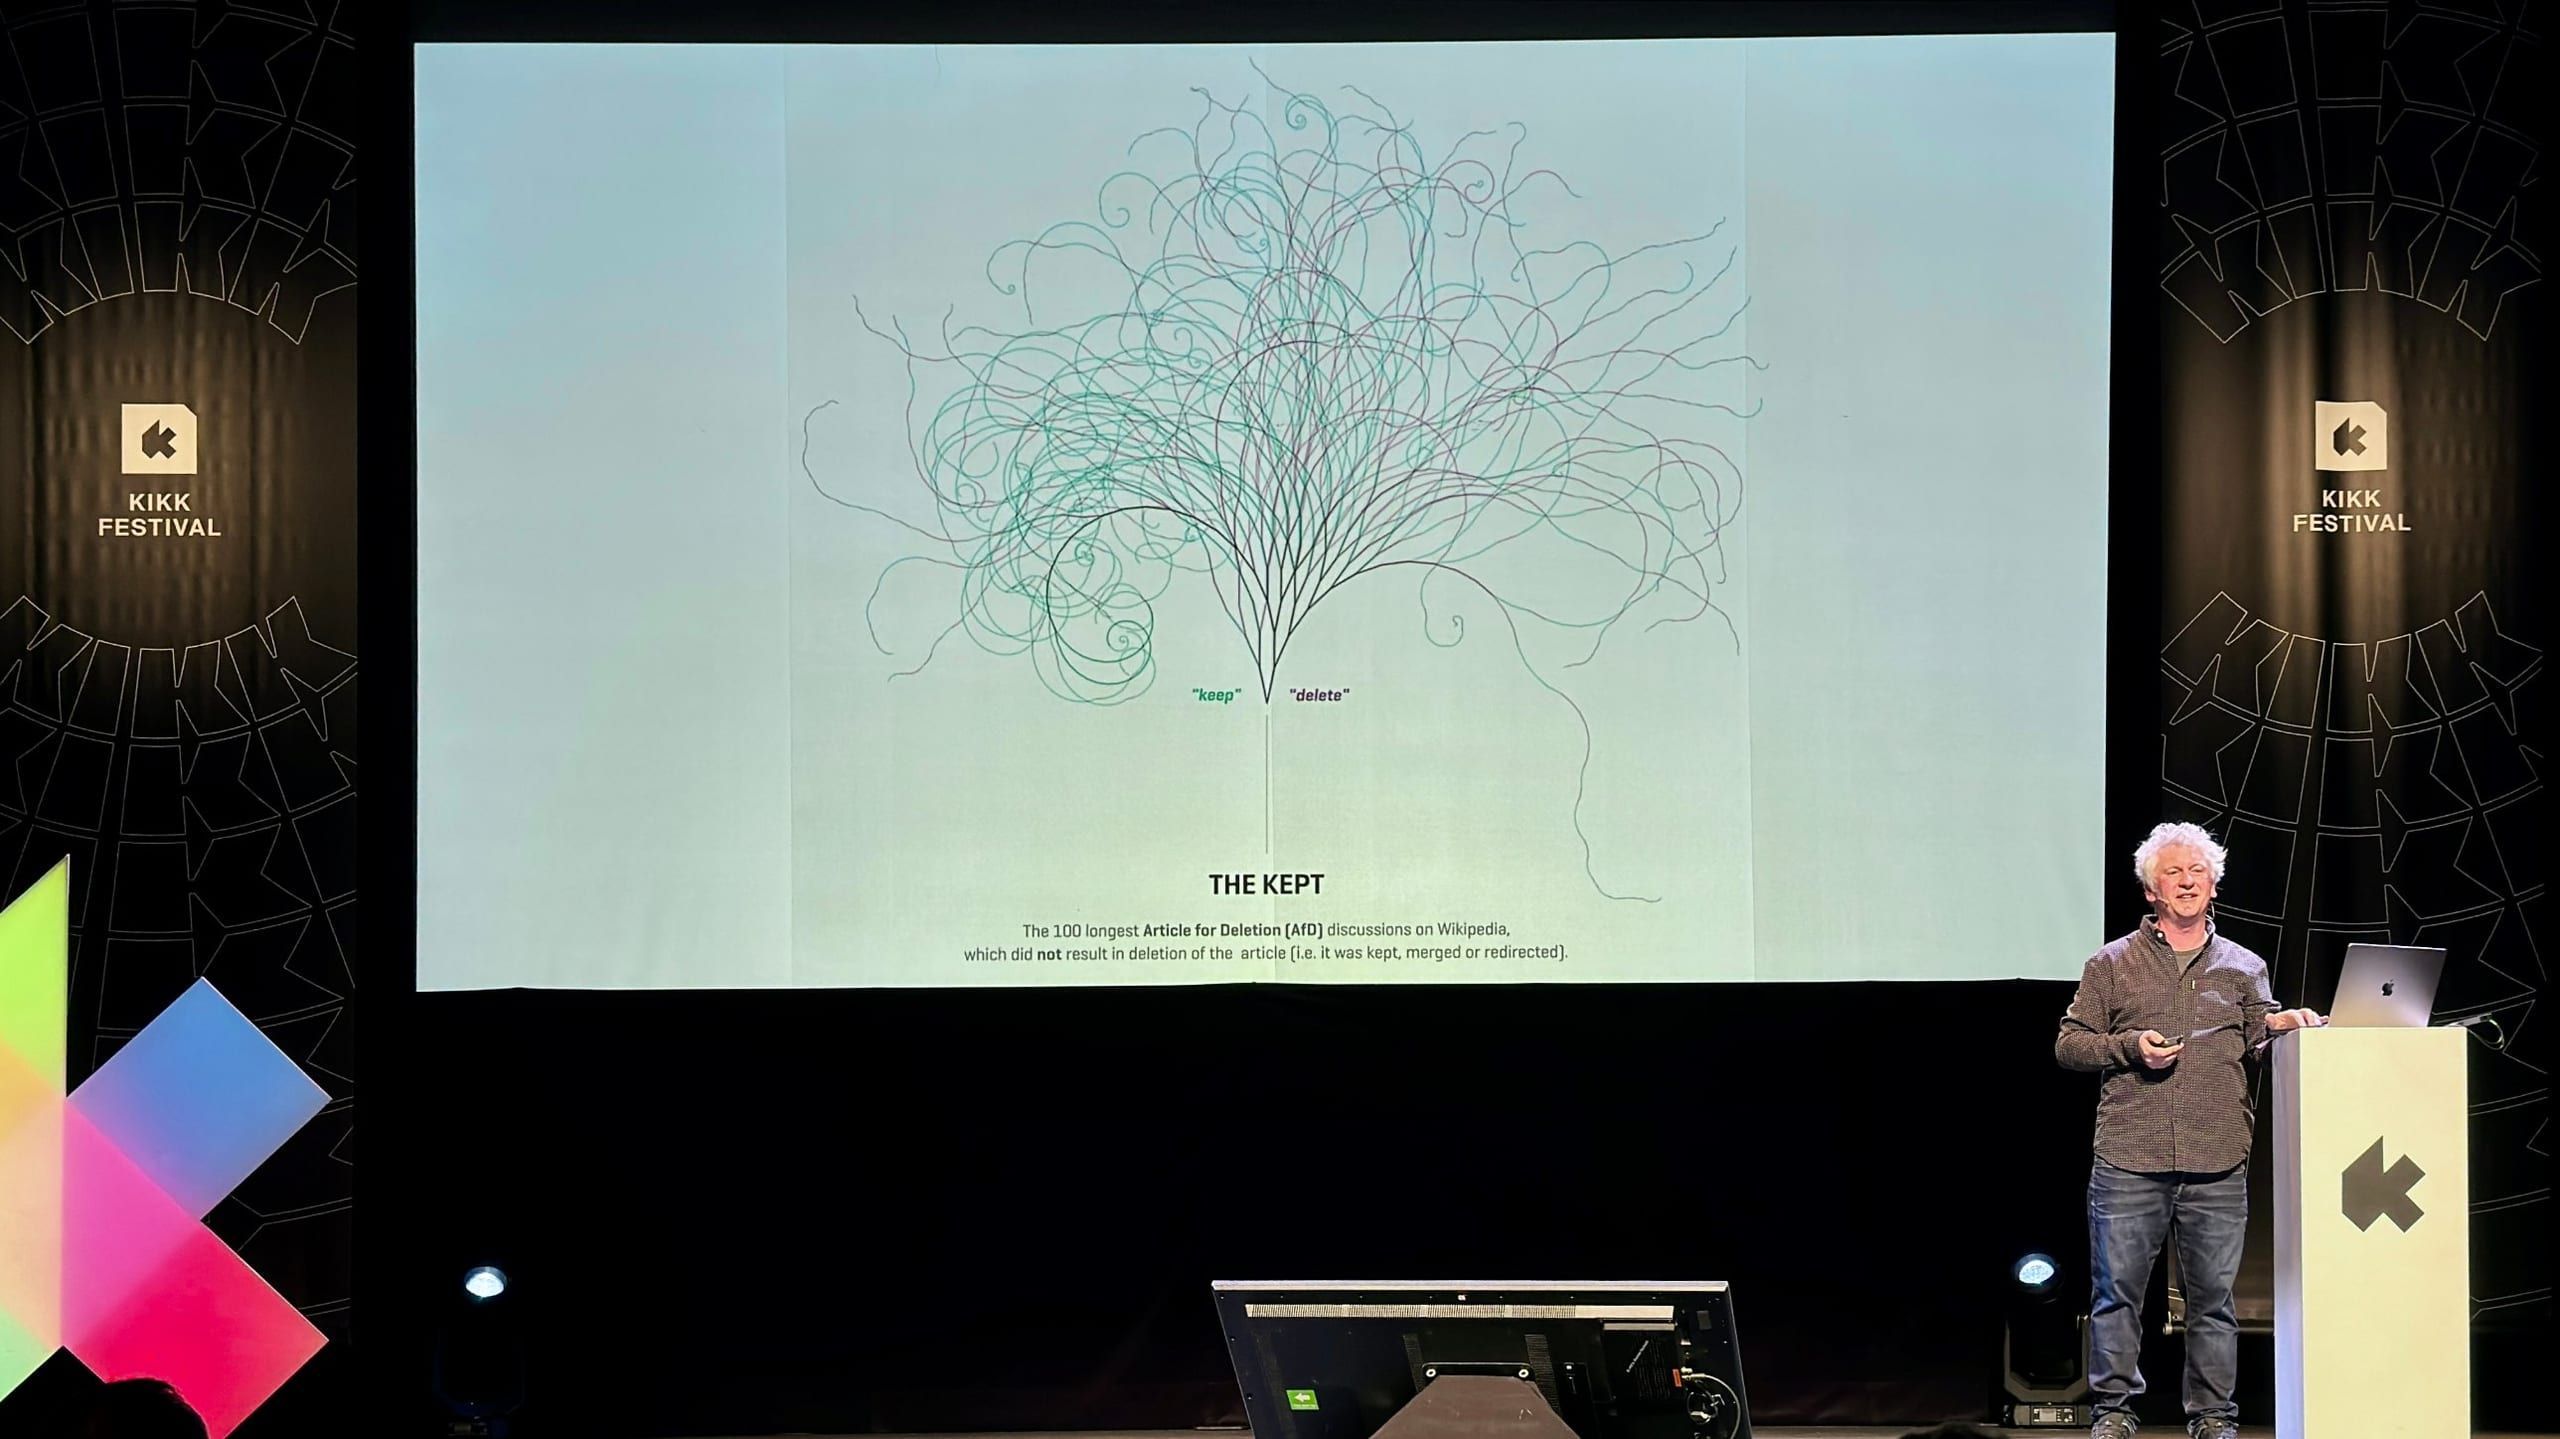
My talk at KIKK Festival 2026 in the Grande Salle of the Théâtre de Namur: Do we still need expert-designed visualizations in an age of automated chart generation?
Namur, Belgium · Talk
All photos: Bryan Nicola Maxwell for KIKK Festival (@kikk_festival)
From global maps of underground fungal networks for SPUN and sunbeams recorded on photo paper to lessons learnt building the official German COVID-19 vaccination dashboard, I showed what a visualization built around one specific question, dataset and audience can do that a template cannot, and why a dedicated, experienced design team matters more now that charts can be generated in seconds.
Related projects

A Hidden Infrastructure
Mapping the underground world of fungi
There is an incredible hidden infrastructure of ecosystems right beneath our feet: arbuscular mycorrhizal fungi. They connect to over 70% of plants, extend root networks up to a 100 times, and reach a length of 1 billion times the distance to the sun. Centered around a globe with ground-breaking new data on the density of these hyphal networks, this data narrative provides a glimpse into this fascinating underground world.

Lilienthal Solargraphy
Physical data recording
I create images of the sunlight using pinhole cameras at my home in Lilienthal, Germany. This image presents a graphical recording of the sun’s position and strength over the course of 6 months in the second half of 2022.

Impfdashboard
The official German COVID-19 vaccination dashboard
How can we visualize the progress of COVID-19 vaccinations in Germany in a concise, appealing and accessible way? Our mobile-first solution for the official vaccination dashboard sets a new standard for governmental data communication around the pandemic.
More talks

Underground Science. Underground Stories.
At the Narrative Change Summit of the Climate Film Festival during NYC Climate Week, I joined a session convened by SPUN on why data alone so rarely moves people, and what makes science stick. I showed how we turned SPUN's maps of underground fungal networks into A Hidden Infrastructure, then talked science storytelling with Toby Kiers (SPUN), Alessandra Yupanqui (Sapiens) and Willow Defebaugh (Atmos), moderated by Mandy Nguyen.

VISCOMM keynote 2025
As invited keynote speaker for the VISCOMM workshop at IEEE VIS conference, I talked about current trends in data visualization, my design approach, and how our profession is changing in the recent wave of AI tools.
 Play video
Truth & Beauty for the German administration
At the 11th Öffentliches Gestalten meetup on "Visualising data", hosted by CityLAB Berlin and DigitalService des Bundes, I shared more recent work for and with the German Federal government — including the Climate—Conflict—Vulnerability Index (CCVI) for the Federal Foreign Office and the official COVID-19 vaccination dashboard for the Federal Ministry of Health.