ON BROADWAY

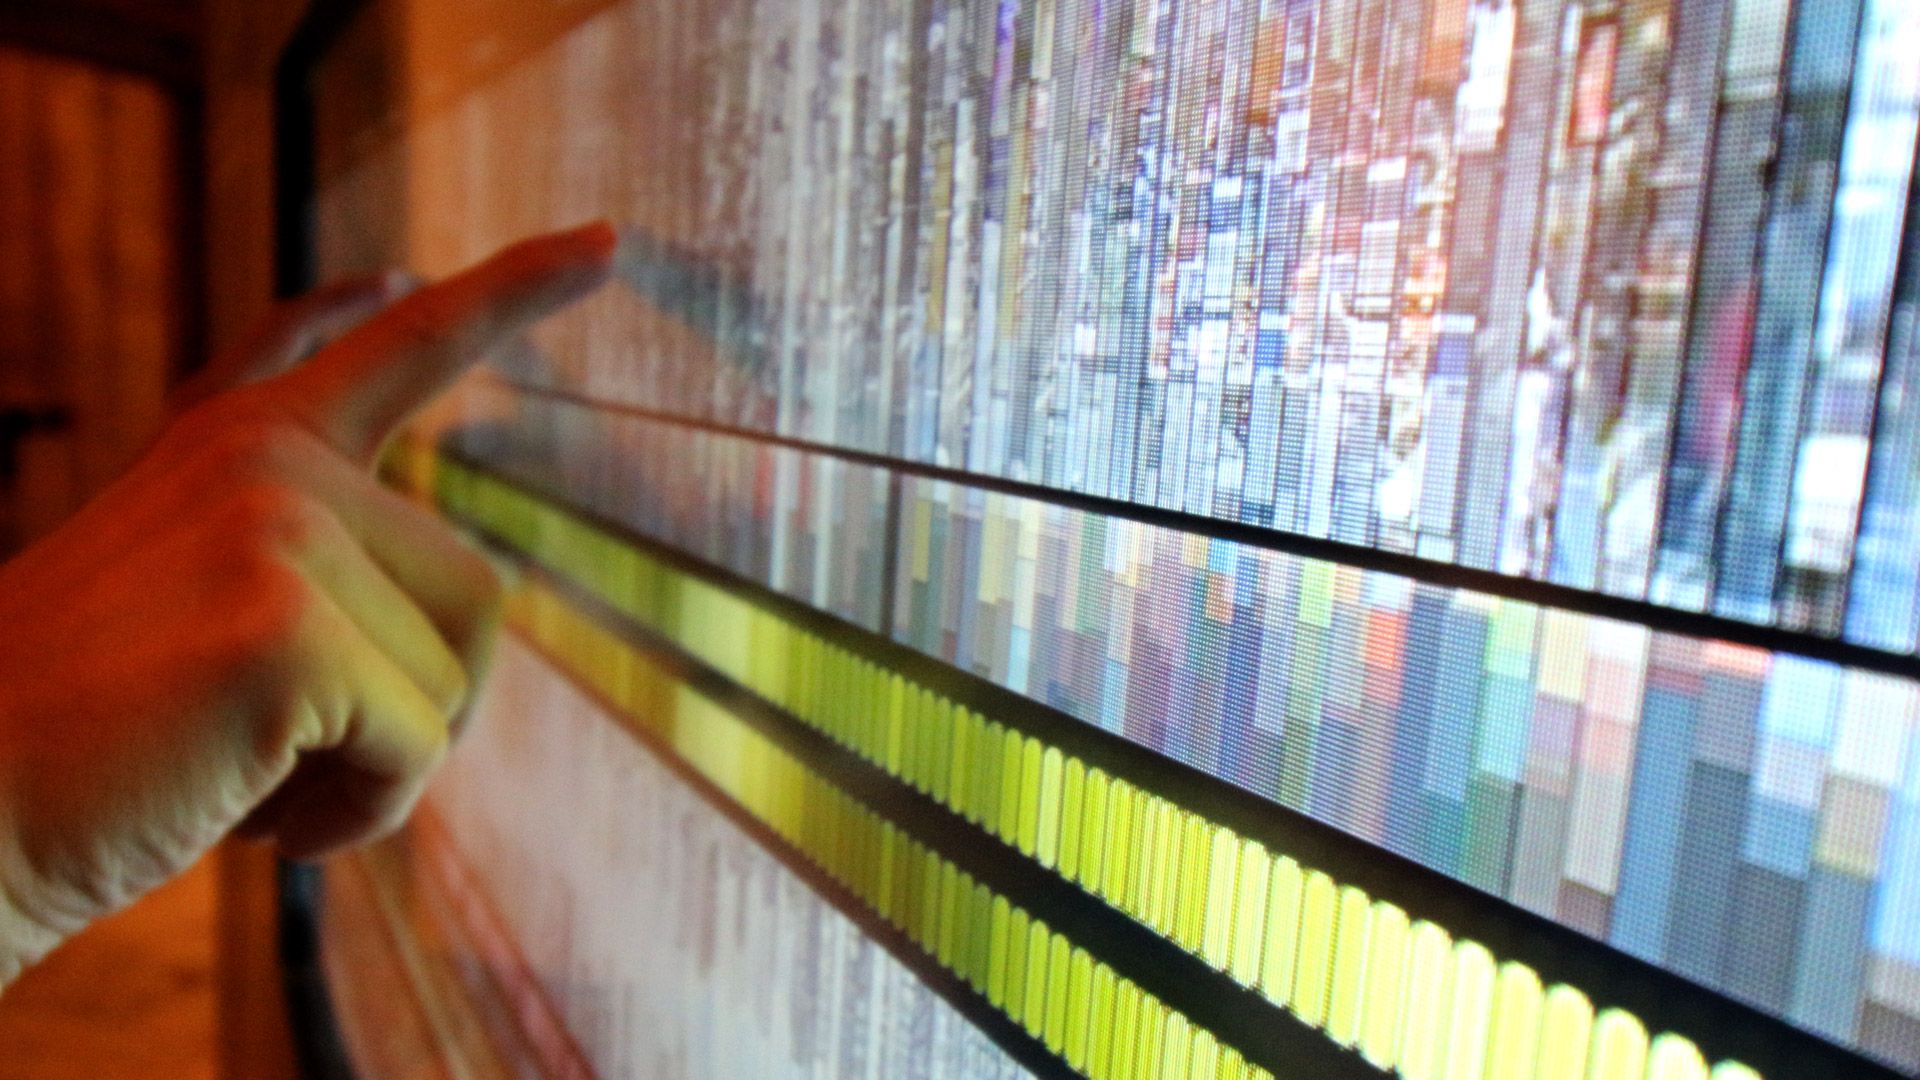
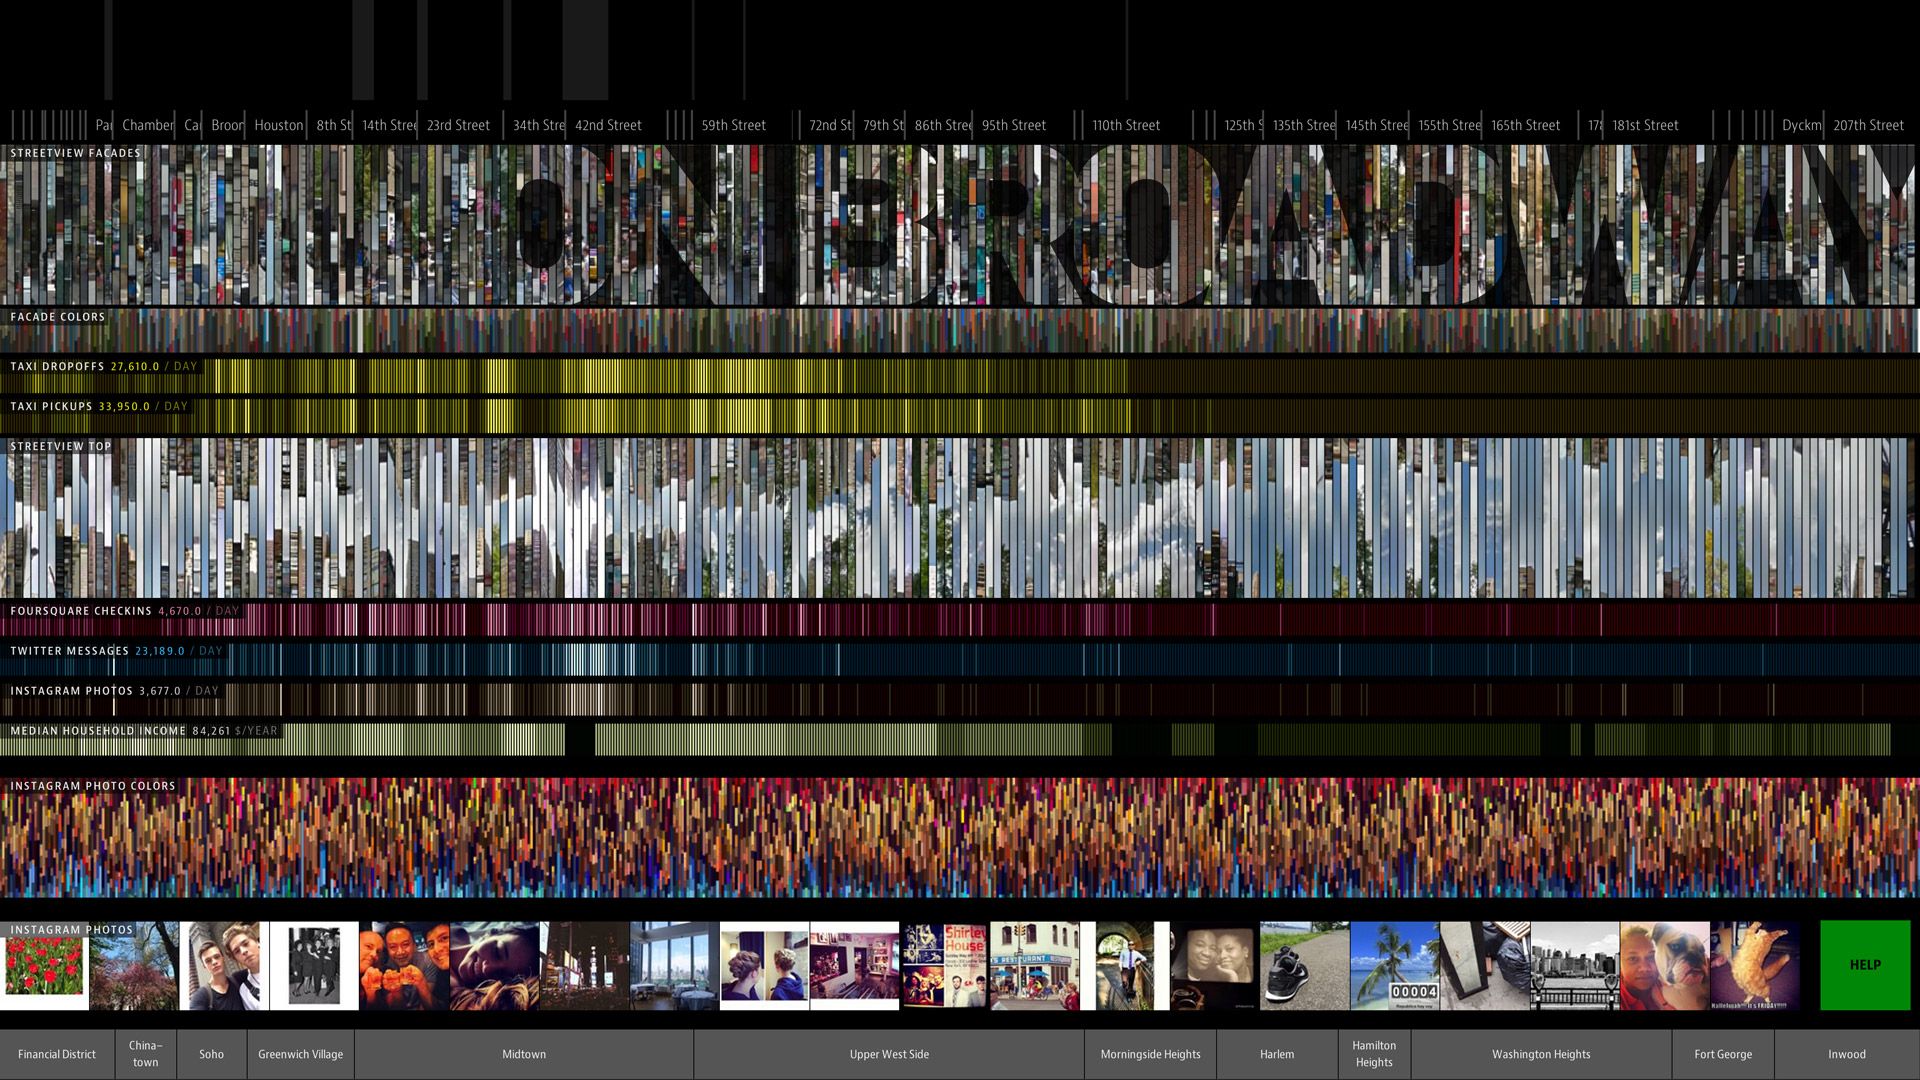
On Broadway enables seamless navigation between high-level condensed views of the city and zoomed in, anecdotal data. In the exploratory phase of the project, we experimented a lot with different remixes and montages of the many data and image materials we had available. The final application reflects this enormous data diversity and richness: from taxi rides and median income to color palettes and Twitter messages.
The project proposes a new visual metaphor for thinking about the city: a vertical stack of image and data layers. There are 13 such layers in the project, all aligned to locations along Broadway. As you move along the street, you see a selection of Instagram photos from each area, left, right, and top Google Street View images and extracted top colors from these image sources. We also show average numbers of taxi pickups and drop-offs, Twitter posts with images, and average family income for the parts of the city crossed by Broadway. To help with navigation, we added additional layers showing names of Manhattan neighborhoods crossed by Broadway, cross-streets and landmarks.

Bonus material
This video montage presents a full walkthrough of broadway from south to north, based on Google Street View image material.
Related

Selfiecity

Stadtbilder

123 data at Fondation EDF, Paris

Information is Beautiful Award 2015

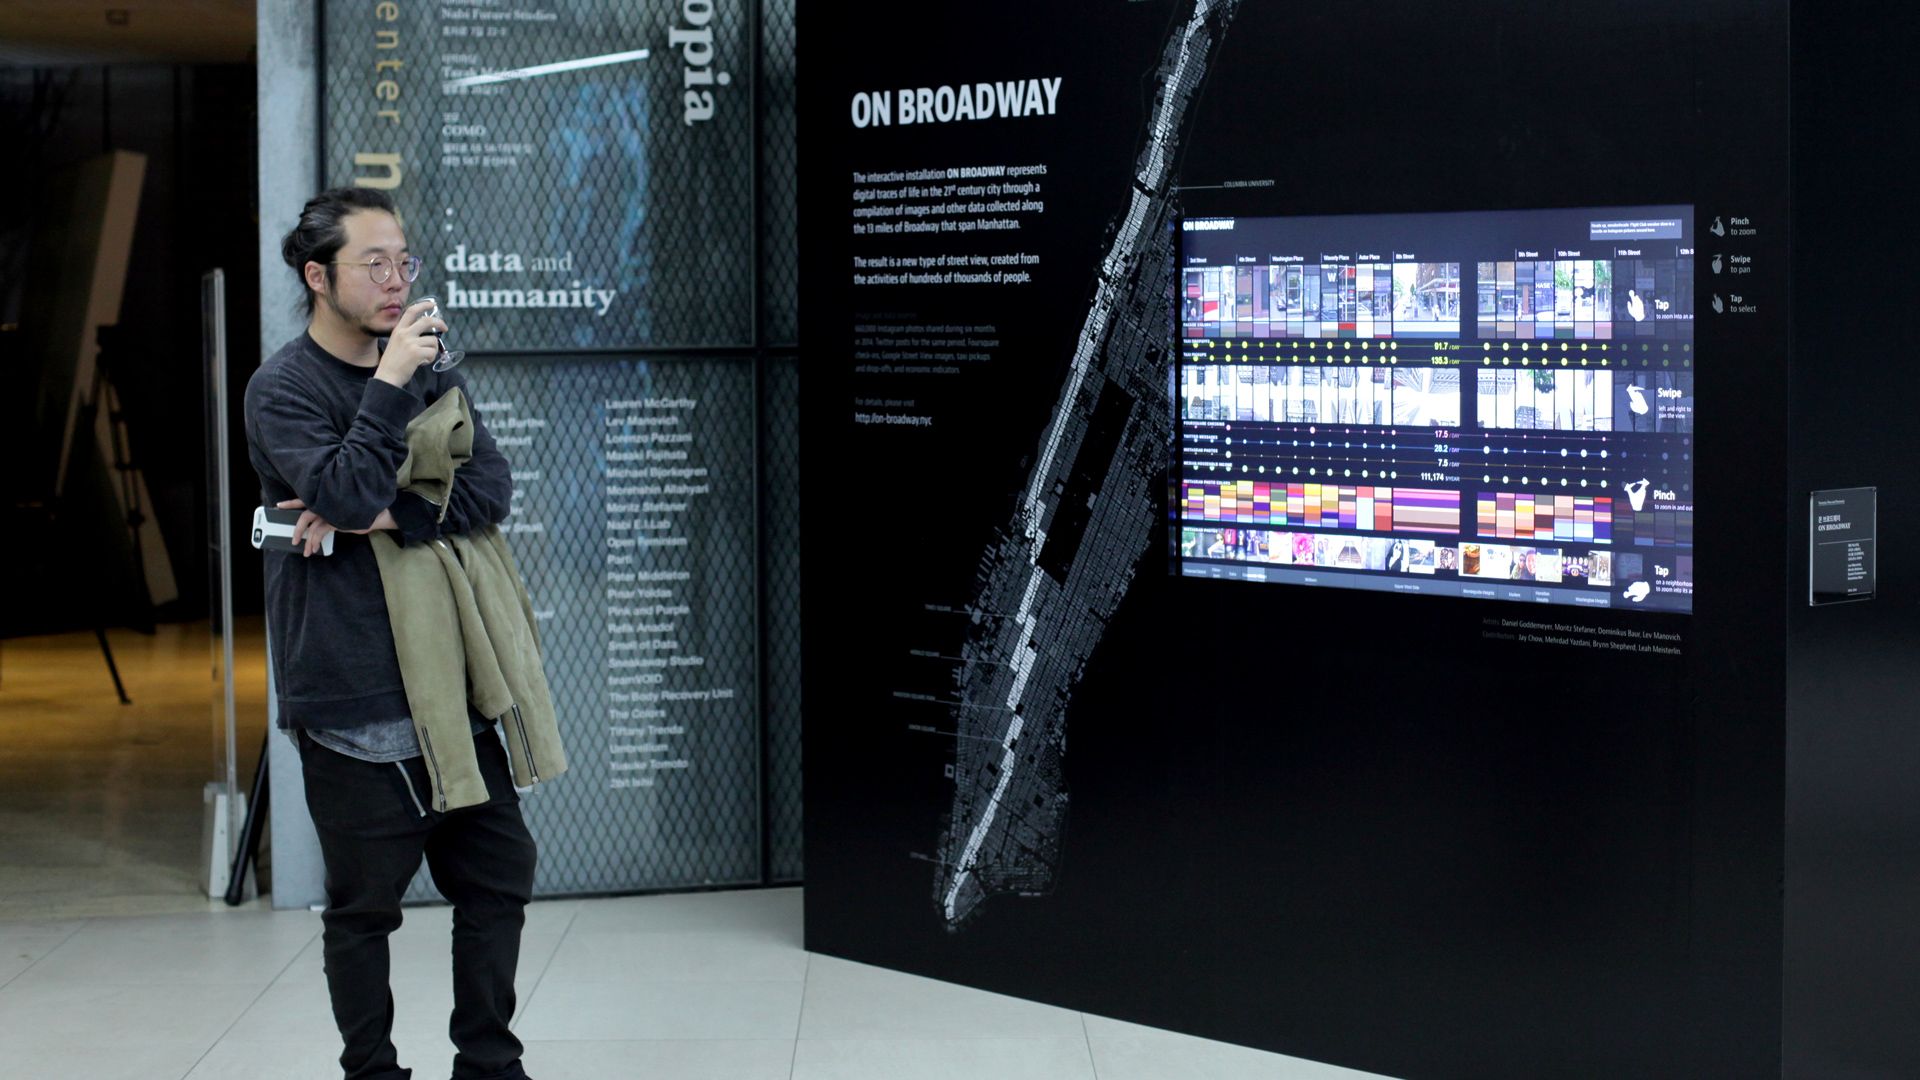
ON BROADWAY exhibited
